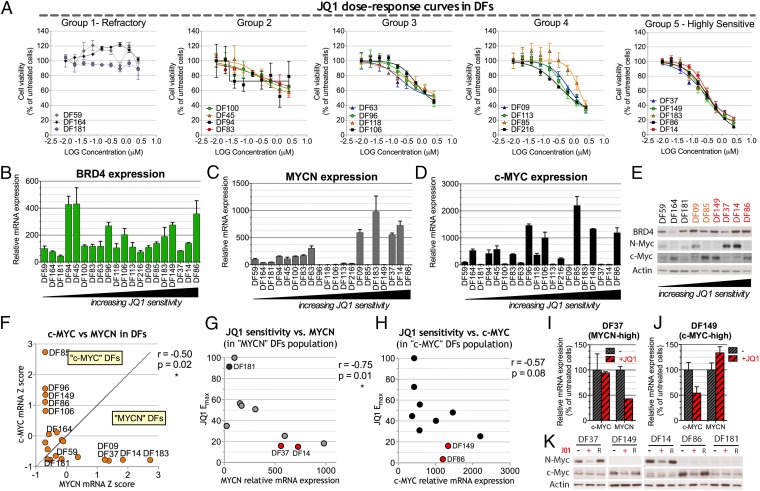
Fig. 4.
Sensitivity of various primary ovarian cancer cell strains (DF) to JQ1 and its relationship to c-MYC or MYCN overexpression. (A) JQ1 dose–response curves performed on 20 different primary serous ovarian cancer cell strains (DFs). Dose–response curve data were integrated by nonlinear regression. DFs were clustered in five groups on the basis of their JQ1 maximum effect (Emax), which, in turn, corresponds to the minimum measured viability value. (B–D) qRT-PCR analysis of BRD4 (B), MYCN (C), and c-MYC (D) in DF strains. Expression values are normalized by reference to that of the housekeeping gene, 36B4, and are reported as a percentage of the levels obtained in the JQ1-refractory strain, DF59. (E) Western blot analysis of a subset of DF strains. Red, JQ1 highly sensitive (group 5); orange, group 4; black: JQ1-refractory (group1). (F) Anticorrelation of c-MYC and MYCN expression in DF strains and definition of ”c-MYC“ and ”MYCN“ strains on the basis of their relative c-MYC and MYCN mRNA levels expressed as z-scores. (G) Pearson correlation of MYCN expression and JQ1 Emax in the MYCN DF population. (H) Pearson correlation of c-MYC expression and JQ1 maximal effect (Emax) in the c-MYC DF population. (I and J) qRT-PCR analysis of c-MYC and MYCN expression after 24-h exposure to 1 μM JQ1 (+) or vehicle a (−) in the MYCN-high strain DF37 (I) and the c-MYC-high strain DF149 (J). Expression values are normalized by comparison with that of 36B4 and reported for each gene as a percentage of the levels obtained with vehicle alone. (K) Western blot analysis in selected DF strains of c-MYC and MYCN expression after 48-h exposure to 1 μM JQ1 (+), the inactive JQ1 enantiomer (R), or vehicle alone (−). DF14 and DF37 represent MYCN-high strains, DF86 and DF149 represent c-MYC-high strains, and DF181 is a JQ1-refractory MYCN-low/ c-MYC-low strain. Where reported, error bars represent standard deviations of triplicate measurements.

