
Fig. 1.
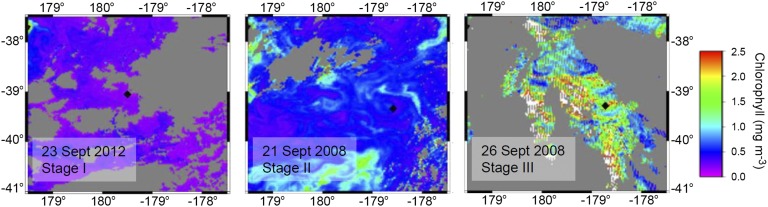
Satellite-derived chlorophyll concentrations for stages I, II, and III of the subtropical spring phytoplankton bloom. Diamond represents the sampling site. Gray areas represent cloud cover during the satellite pass-over. MODIS Aqua satellite data obtained from ERDDAP and plotted using Generic Mapping Tools (46).