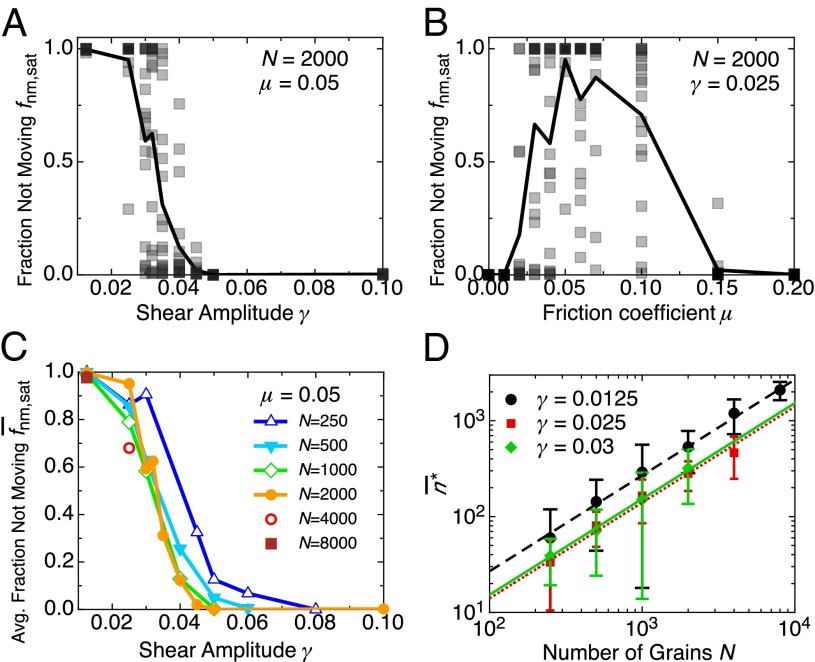
Fig. 5.
Limit Cycle phase boundaries and onset. (A) vs. γ for . (B) vs. μ for . (A and B) Squares: individual realizations. Solid line: ensemble average. (C) Ensemble averaged vs. γ at , varying the number of grains N. (D) Average number of shear cycles needed to establish a limit cycle vs. N for . Lines show fits to with (dashed line, ) , (dotted line, ) , and (solid line, ) . For ensemble averages, we used 20 realizations for , 12 realizations for , and 5 realizations for . Error bars in D show the SD within an ensemble.

