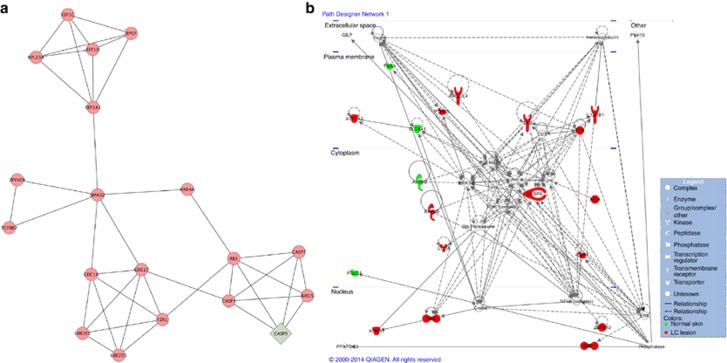
Figure 3.
Network and canonical pathway built with 59 differentially expressed proteins. (a) Subnetwork modules associated with apoptosis extracted from the whole network using an MCODE tool. (b) Cytotoxic T lymphocyte–mediated apoptosis of target cell network (P<0.003) performed by Ingenuity Pathway analysis. The red color is an indication of the upregulated/unique proteins expressed in cutaneous leishmaniasis (CL) lesions, and green color indicates downregulated/unique proteins expressed in normal skin. Full and dashed lines represent direct and indirect interactions, respectively, between the proteins. Network shapes are represented in the legend.

