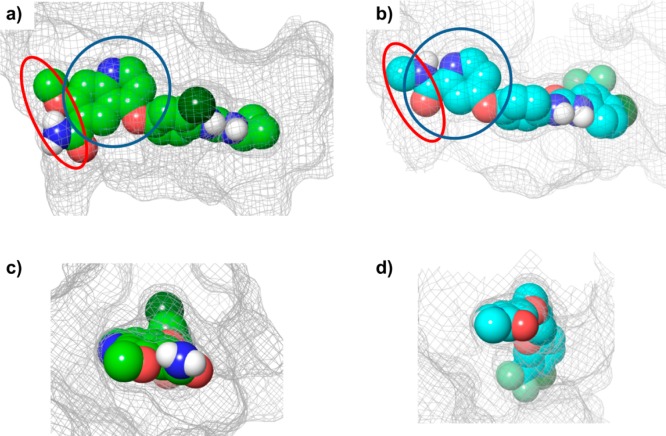
Figure 2.
Binding pocket of VEGFR2 in complex with each ligand. Each ligand is presented as a CPK model, and the Connolly surface areas of the binding sites are presented as a mesh. The adenine ring binding site is indicated by the blue circle and the entrance region by the red circle. (a) View from the N-terminal domain of VEGFR2 complexed with lenvatinib. (b) View from the N-terminal domain of VEGFR2 complexed with sorafenib. (c) View from the entrance region of VEGFR2 complexed with lenvatinib. (d) View from the entrance region of VEGFR2 complexed with sorafenib. Panels (a) and (b) show that lenvatinib occupies a wider area at the adenine ring binding site than does sorafenib. It is also clear from panels (c) and (d) that lenvatinib binds more effectively at the entrance region than does sorafenib.

