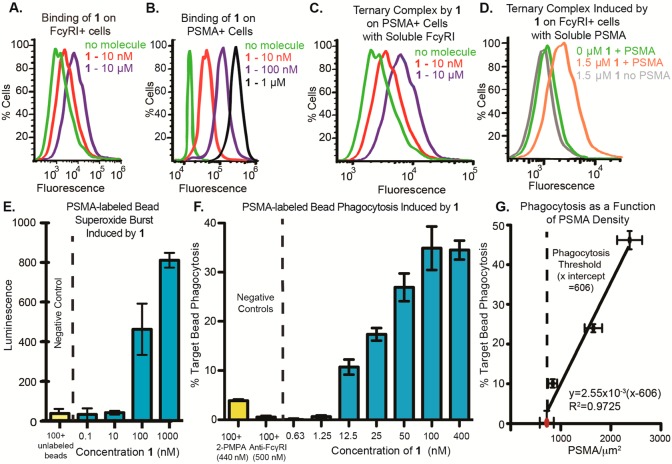
Figure 2.
Binding and functional properties of SyAM-P1 (1). (A) SyAM-P1 binds FcγRI-expressing cells in a concentration-dependent manner. Binding was measured by probing with fluorescently labeled streptavidin, which associates with the biotin function in 1. (B) SyAM-P1 binds PSMA-expressing cells in a concentration-dependent manner. Binding was measured by probing with fluorescently labeled streptavidin, which associates with the biotin function in 1. (C) Ternary complex formation between 1, PSMA-positive LNCaP cells, and soluble recombinant FcγRI, probing with a fluorescent anti-FcγRI antibody. (D) Ternary complex formation between 1, FcγRI-positive cells, and soluble recombinant human PSMA (his-tagged), probing with an anti-his antibody. (E) Superoxide burst generation from primed FcγRI-positive cells, induced by 1 bound to PSMA-labeled beads. Superoxides were detected by their reactivity with the chemiluminescent compound lucigenin. Peak luminescence generated during an 80 min time course is shown. (F) Phagocytosis of fluorescent PSMA-labeled beads by primed FcγRI-positive cells induced by compound 1. Phagocytosis was calculated as percent of targets phagocytosed minus background phagocytosis with 0 nM compound. (G) Effect of PSMA density on target cells on SyAM-P1-induced phagocytic response. The red dot indicates the PSMA level measured on RM1.PGLS cells, while black dots indicate PSMA level on labeled beads. All data points reflect the phagocytic response induced using a 50 nM concentration of SyAM-P1. The x-intercept was determined to be 606 PSMA/μm2 by linear regression analysis using Prism 5 (GraphPad). For functional assays in panels E and F, data points represent the mean of at least duplicate samples plus/minus standard deviation, and the reported trends were reproduced on at least three separate occasions.

