
Figure 12.
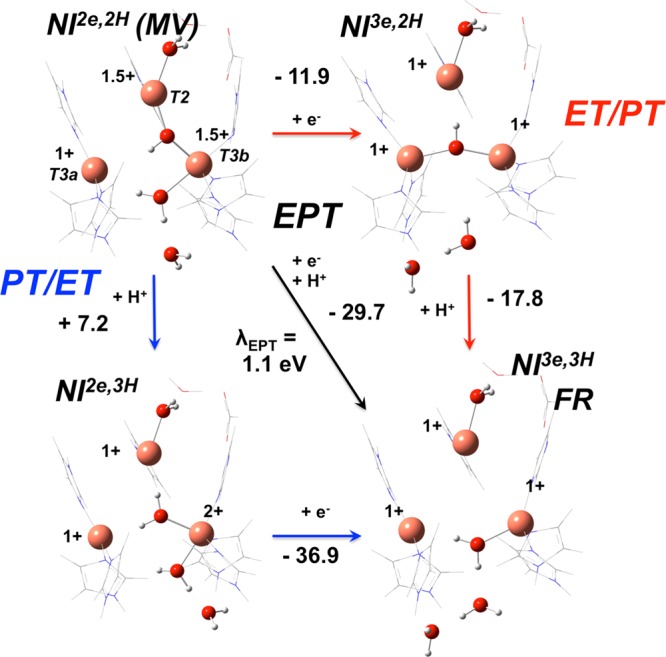
DFT calculations of the third IET step. All energies reflect Gibbs free energies (ΔG) in units of kcal/mol. Distances and spin densities for these structures are reported in Table 4. Histidine of the T2 removed for clarity. Colors: Cu, orange; O, red; N, blue; C, gray; H, white. ET/PT, PT/ET, and EPT pathways labeled in red, blue, and black, respectively.