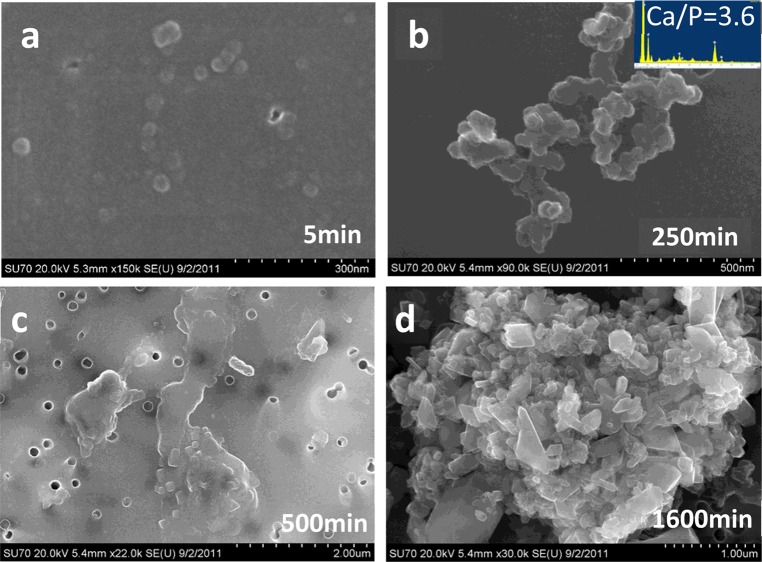
Figure 5.
SEM micrographs depicting the morphology evolution of calcium oxalate precipitates during the induction period in the presence of phosphate ([P] = 8.0 × 10⁻³ M, [Ca2+] = [Ox2–] = 3.81 × 10⁻⁴ M, σDCPD = −0.42, and σHAP = 2.76) with supersaturation degree of σCOM = 0.745 at initial pH 6.5 and ionic strength 0.15 M. The induction time was 590 min.

