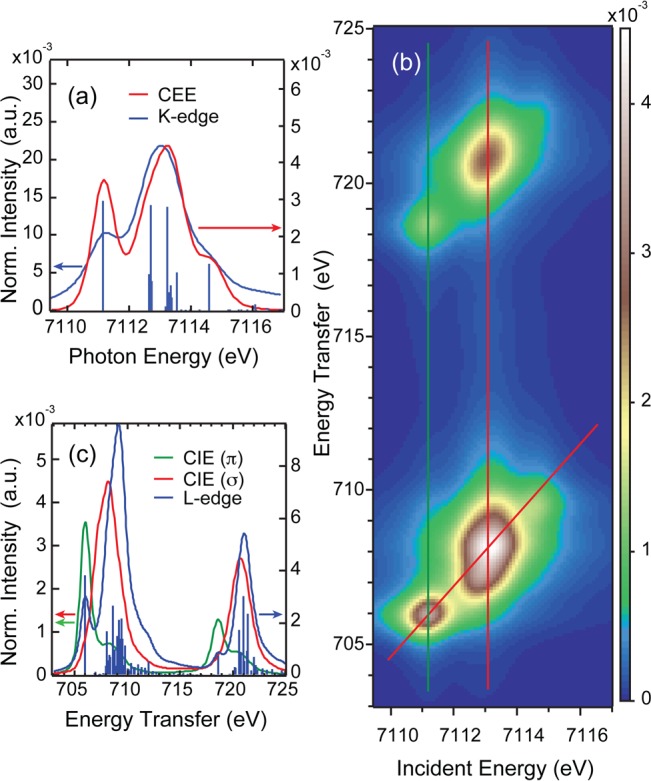
Figure 10.

Fe(III)TPP(ImH)2 simulations: (a) Comparison of the CEE cut along the red diagonal line in (b) with the simulated K-edge, (b) 1s2p RIXS plane simulation, (c) comparison of the CIE cuts along the green and red vertical lines in (b) with the direct L-edge simulation.
