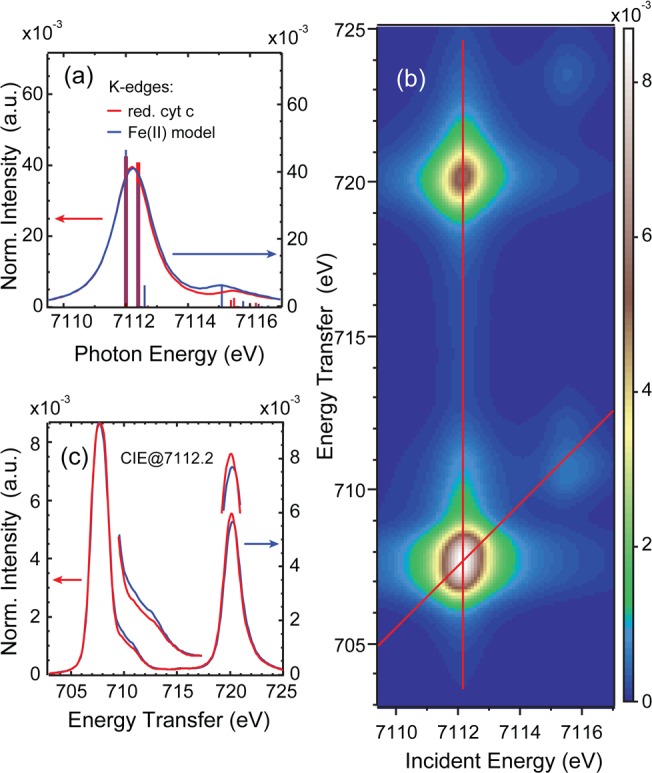
Figure 7.

Ferrous cyt c simulations: (a) comparison of the CEE cut along the red line in (b) with the CEE cut of the model complex simulation, (b) 1s2p RIXS plane simulation, (c) comparison of the CIE cut along the vertical red line in (b) with the CIE cut of the model complex simulation.
