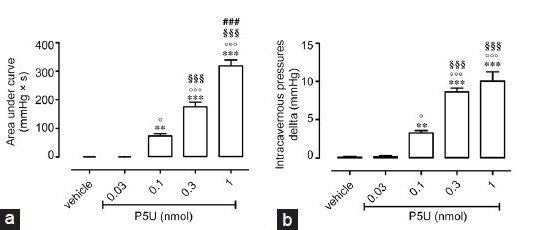
Figure 2.

(a) Intracavernous injection of P5U (0.03–1 nmol) causes an increase in intracavernous pressure expressed as area under the curve (mmHg × s). ***P < 0.001 and **P < 0.01 versus vehicle, °P < 0.05 and °°°P < 0.001 versus P5U 0.03 nmol, §§§P < 0.001 versus P5U 0.1 nmol, ###P < 0.001 versus P5U 0.3 nmol or (b) Delta of increase (mmHg) ***P < 0.001 and **P < 0.01 versus vehicle, °P < 0.05 and °°°P < 0.001 versus P5U 0.03 nmol, §§§P < 0.001 versus P5U 0.1 nmol. Data are calculated as mean ± standard error of mean of n = 7 experiments and analyzed by ANOVA followed by Bonferroni as posttest.
