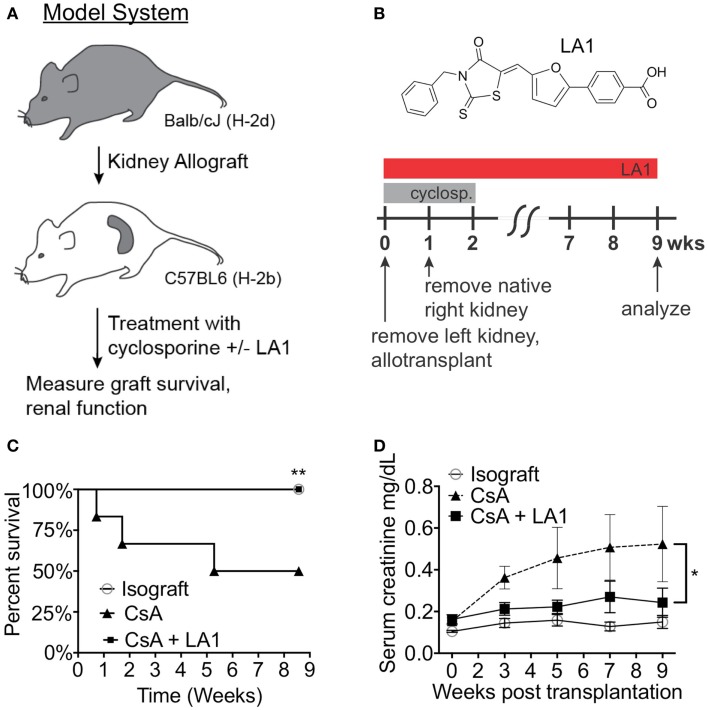
Figure 2.
LA1 treatment prolongs transplant survival and increases kidney function. (A) A flow diagram describing the mouse model of chronic allograft nephropathy utilized in this study. (B) Schematic representing the timeline of treatment with CsA and/or LA1 and the allogeneic kidney transplant surgery as described in the Section “Concise Methods.” The chemical structure of LA1 is also shown on the top. (C) A Kaplan–Meier plot of graft survival for isografts (non-filled circles, n = 3) or allografts treated with either CsA alone (triangles, n = 4) or a combination of CsA and LA-1 (squares, n = 5) over time (in weeks). Significance was determined using the Log-rank (Mantel–Cox) test. **P < 0.01 (D) A plot showing LC-MS/MS-based quantification of serum creatinine levels in various samples at the indicated time points. Whole blood was collected at the indicated time points via retro-orbital puncture from experimental animals from isograft group (non-filled circles) or allograft groups treated with either CsA alone (triangles) or a combination of CsA and LA-1 (squares). Data shown are mean ± SEM (n = 5/group). Significance was determined using a two-tailed Student’s t-test and the calculated P-value is shown. *P < 0.05.

