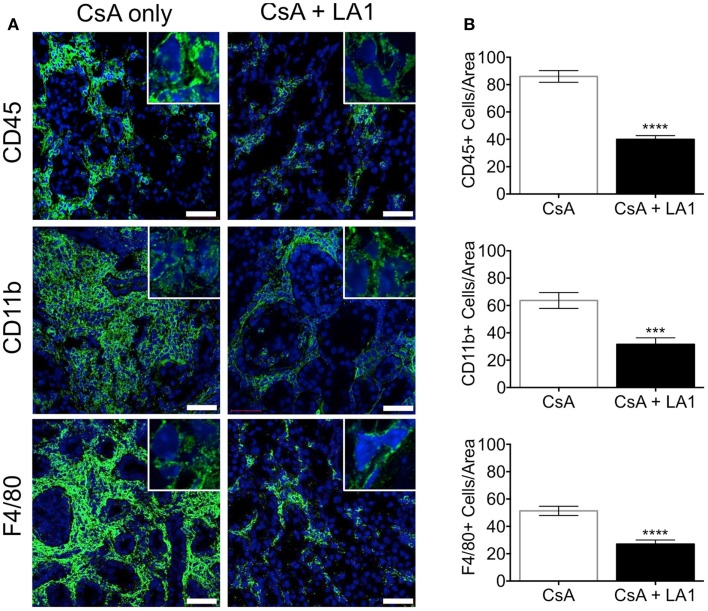
Figure 5.
LA1 treatment reduces perivascular infiltration of macrophages. (A) Representative micrographs of kidney allograft tissue sections from control (CsA alone) and LA1-treated (CsA + LA1) animals after immunofluorescence analyses. Sequential sections from each tissue were stained with antibodies against CD45, CD11b, or F4/80, as indicated, followed by fluorescently labeled secondary antibodies and then imaged using a confocal microscope. Inset shows image of an area of 60× magnification. Images are representative of 4–5 independent samples per group. Scale bar = 50 μm. (B) Plots showing quantification of number of positive cells/area for each marker, as shown in (A). Three random areas per tissue were evaluated at 60× magnification by manually counting positively stained cells. Data shown are mean ± SEM (n = 4–5/group). Significance was determined using a two-tailed Student’s t-test. ***P < 0.001; ****P < 0.0001.

