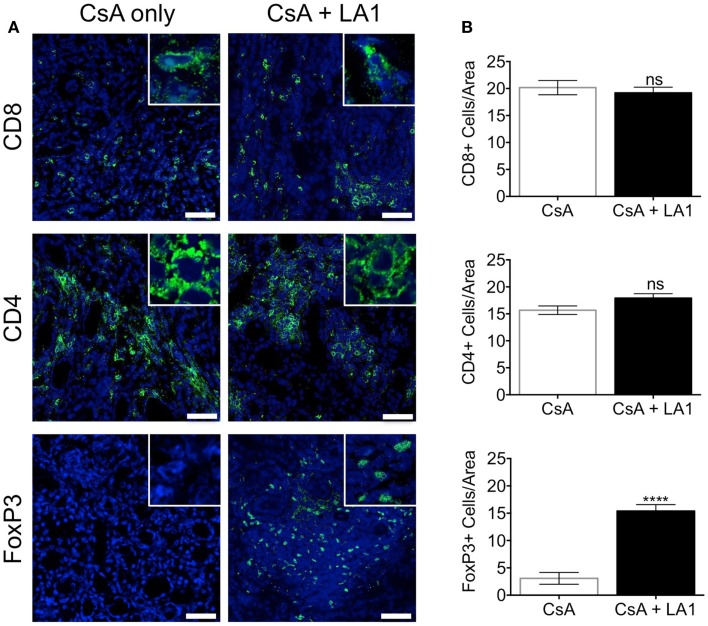
Figure 6.
LA1 treatment does not affect the number of CD8+ and CD4+ T-cells infiltrating the allograft but increases the frequency of infiltrating FoxP3+ regulatory T-cells. (A) Representative micrographs of kidney allograft tissue sections from control (CsA alone) and LA1-treated (CsA + LA1) animals after immunofluorescence analyses. Sequential sections from each tissue were stained with antibodies against CD8, CD4, and intracellular FoxP3 in allografts, as indicated, followed by fluorescently labeled secondary antibodies and imaged using a confocal microscope. Inset shows image of an area at 60× magnification. Images are representative of 4–5 independent samples per group. Scale bar = 50 μm. (B) Plots showing quantification of the number of positive cells/area for each marker, as shown in (A). Three random areas per tissue were evaluated at 60× magnification by manually counting positively stained cells. Data shown are mean ± SEM (n = 4–5/group). Significance was determined using a two-tailed Student’s t-test. ns: not statistically significant. ****P < 0.0001.

