Figure 4.
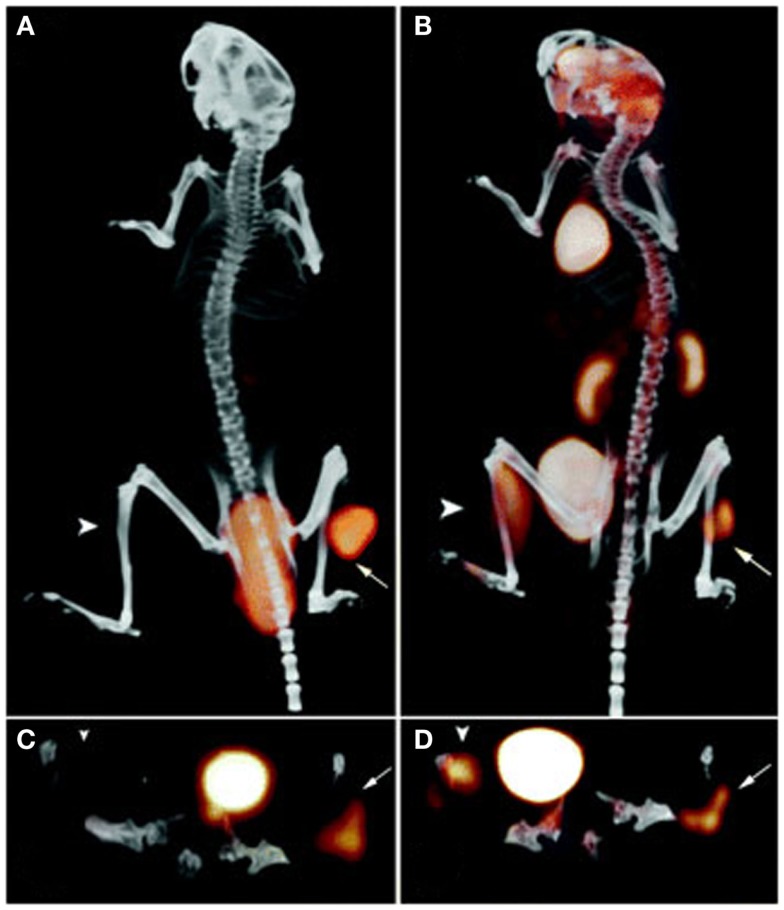
PET/CT images of a BALB/c nude mouse with a s.c. LS174T tumor on the right hind leg (arrow) and an inflammation in the left thigh muscle (arrowhead), which received 18F-FDG and, 1 day later, 6.0 nmol TF2 and 68Ga-IMP288 (0.25 nmol) with a 16-h interval. The animal was imaged 1 h after 18F-FDG and 68Ga-IMP288 injections. The panel shows the three-dimensional volume rendering the pretargeted immuno-PET scan (A) and the FDG-PET scan (B), and the transverse sections of the tumor region of the pretargeted immuno-PET scan (C) and the FDG-PET scan (D). This research was originally published in Schoffelen et al. (48, 50).

