Figure 1.

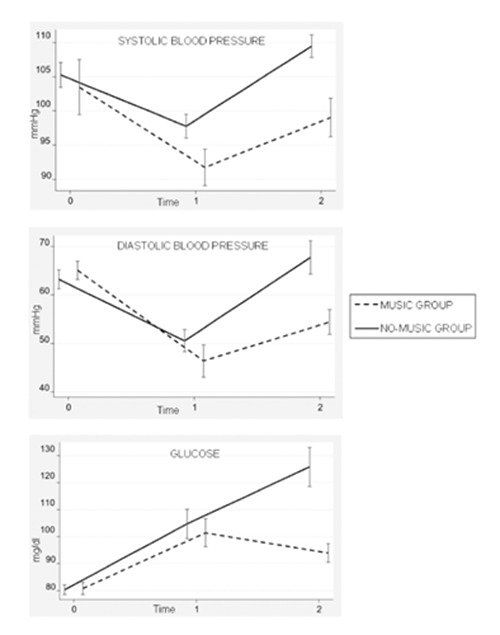
Comparison of the blood pressure and glucose levels at admission (Time 0), at the end of surgical procedure (Time 1) and during awakening (Time 2), in music and no-music groups.

Comparison of the blood pressure and glucose levels at admission (Time 0), at the end of surgical procedure (Time 1) and during awakening (Time 2), in music and no-music groups.