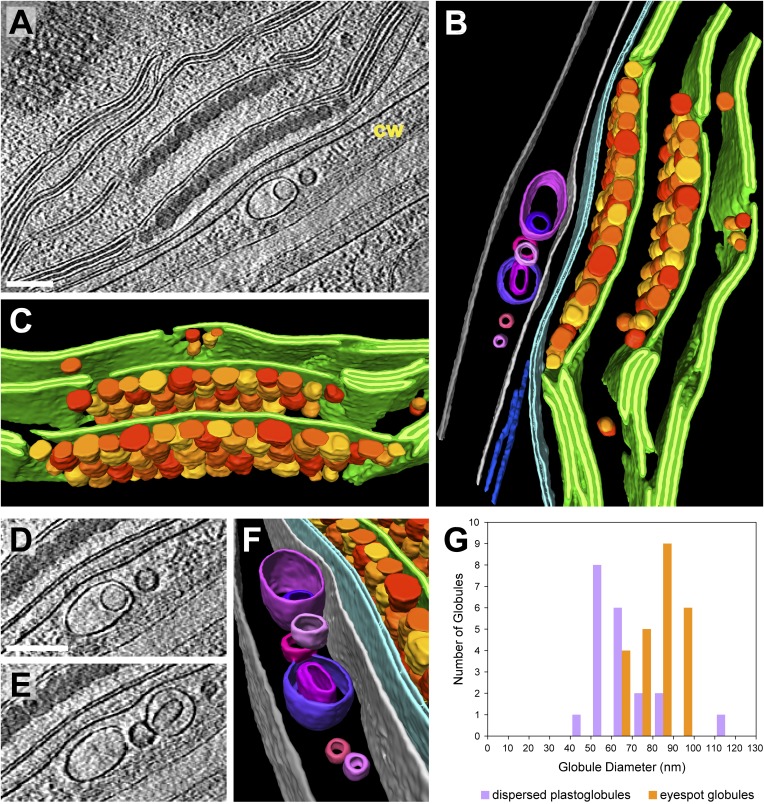
Figure 14. 3D architecture of the eyespot.
(A) A slice from a tomographic volume (cw: cell wall) and (B) corresponding 3D segmentation (rotated ∼90° from A) showing thylakoid membranes (dark green), thylakoid lumina (light green), eyespot globules (yellow, orange, and red), the chloroplast envelope (light blue), flagellar root microtubules (dark blue), the plasma membrane (light grey), the outer border of the cell wall (dark grey), and cell wall vesicles (purple and pink). (C) A view of the segmentation with the chloroplast envelope and plasma membrane removed, revealing the close-packed arrangement of eyespot globules along specialized thylakoid regions. (D–E) Two sequential tomogram slices and (F) corresponding 3D segmentation showing vesicular bodies adjacent to the eyespot, embedded between the plasma membrane and the outer border of the cell wall. (G) Histogram comparing eyespot globule sizes with the sizes of plastoglobules found elsewhere in the chloroplast. The tomogram was 2× binned. Unbinned pixel size: 9.6 Å. Segmented tomogram thickness: 210 nm. Scale bars: 200 nm.

