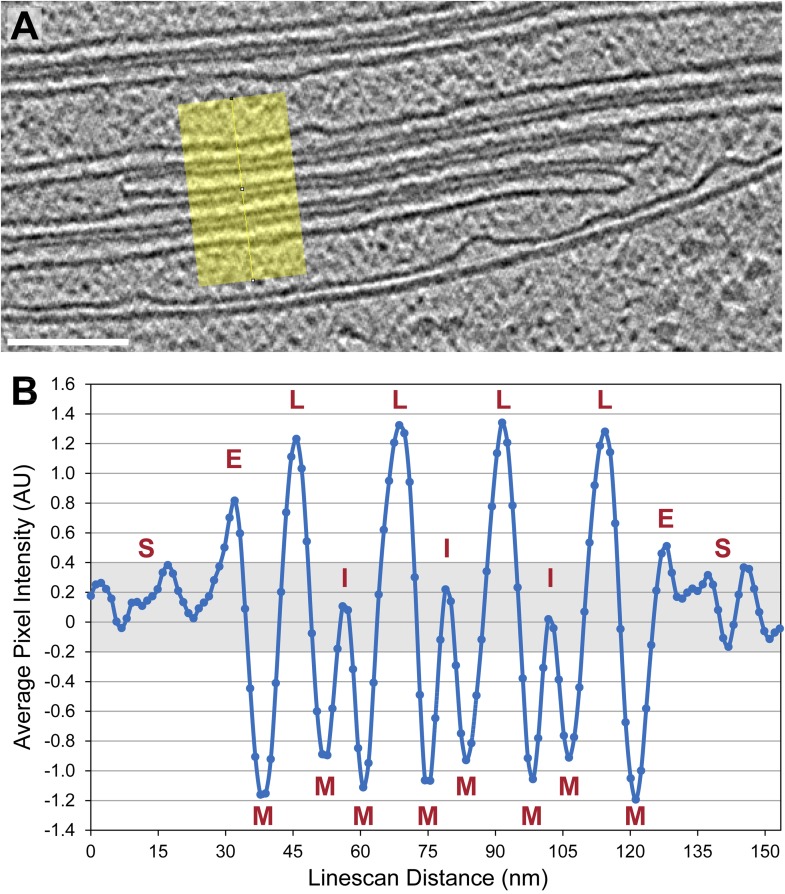
Figure 2. Thylakoid lumina are less dense than the interthylakoid stromal space and the chloroplast stroma.
(A) A line scan through a 2D slice of the tomogram shown in Figure 6A. While tomograms were binned twice for segmentation, here the tomogram was binned only once, reducing the pixel size to 11.4 Å while decreasing contrast (unbinned pixel size: 5.7 Å). Line width: 80 pixels. Scale bar: 100 nm. (B) A profile from the line scan in A (top to bottom), plotting the average pixel intensity along the line. S: chloroplast stroma, E: edge of the thylakoid stack, M: membrane, L: thylakoid lumen, I: interthylakoid stromal space. The grey area of the plot corresponds to the range of intensity values commonly found in the chloroplast stroma. While intensities of the interthylakoid stromal spaces are within this range, the thylakoid lumina are brighter (and thus less dense). AU: arbitrary units. Line scan analysis was performed with Fiji (ImageJ, NIH).

