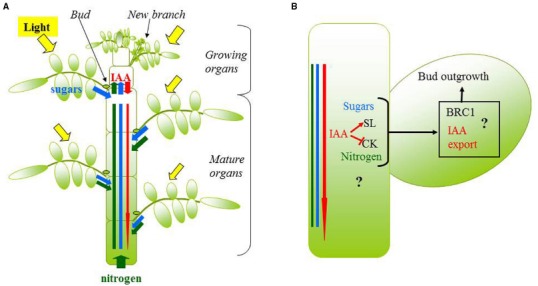
FIGURE 3.

Schematic representation of the main processes and players of bud outgrowth that should be represented in a model, consisted in a plant module (A) and a bud module (B). In (A), plant structure is explicitly represented and coupled with a light model to simulate the light perceived by each organ (in yellow). The level of sugar (blue rectangle), nitrogen (green rectangle) and auxin (IAA; red thin arrow) near each bud is the result of the production or assimilation by source organs (photosynthetic organs for sugars, roots or leaves for nitrogen, growing organs for auxin; large arrows), the utilization by sink organs (growing organs for sugars, nitrogen, and roots for auxin; large arrows), and possibly transport processes (red thin arrow). In (B), the concentration of sugars, nitrogen, and auxin near a bud interact with cytokinins and strigolactones in the stem, to control bud outgrowth through key integrators in the bud such as BRC1 or auxin transport.
