
Figure 3.
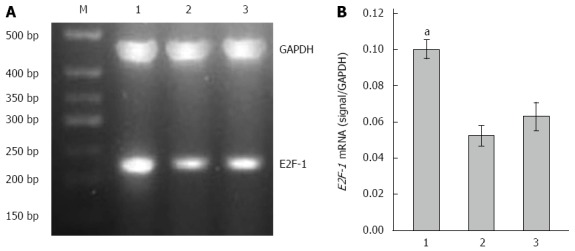
Overexpression of E2F-1 mRNA with LV-GFP-E2F-1. A: Agarose gel analysis of E2F-1 and glyceraldehyde-3-phosphate dehydrogenase (GAPDH) real-time polymerase chain reaction products amplified from MGC-803 tumor tissues (M, 500 bp marker); B: Expression of E2F-1 mRNA was measured in the three groups and normalized to GAPDH (n = 8 animals for each condition). 1, LV-GFP-E2F-1 group; 2, LV-GFP-NC group; 3, phosphate buffered saline control group. aP < 0.05 using analysis of variance and Student-Newman-Keuls analyses.