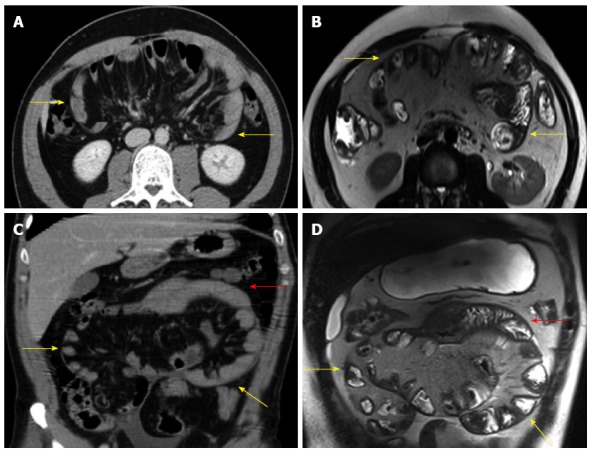
Figure 5.

Comparison of diagnostic features on computed tomography and magnetic resonance images[5]. A: Computed tomography scan in the axial plane showing a subtotal conglomeration of small bowel loops coiled in a concertina-like fashion and encased by a thick membrane (yellow arrows); B: T2-weighted magnetic resonance imaging sequence in the axial plane showing bowel loops aggregated in a festoon-like shape and encased by a thick membrane (yellow arrows); C: Computed tomography scan in the coronal plane showing the conglomeration of small bowls loops (yellow arrows); a few free loops are present in the upper quadrant (red arrow); D: T2-weighted magnetic resonance imaging sequence in the coronal plane showing the same conglomerated small bowel loops (yellow arrows) and a few free bowel loops (red arrow).
