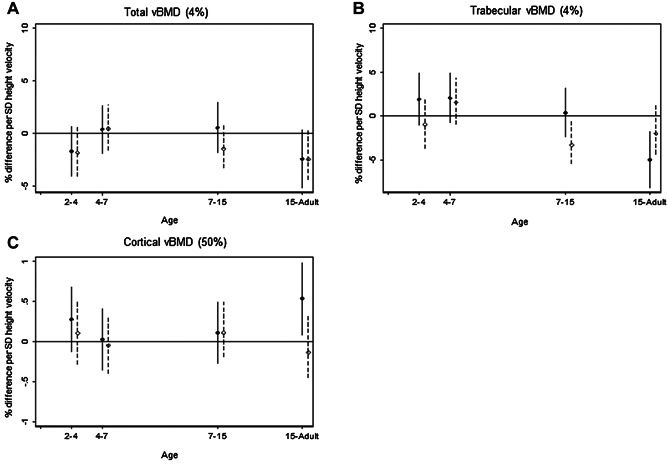
Figure 3.

Height velocity. Percentage difference and 95% CI in (A) total vBMD and (B) trabecular vBMD (4% site), and (C) cortical vBMD (50% site), at 60 to 64 years per 1 SD increase in height velocity, adjusted for standardized height and weight at the beginning of the growth interval and corresponding standardized weight velocity. Solid line for males; dashed line for females.
