
FIG 1.
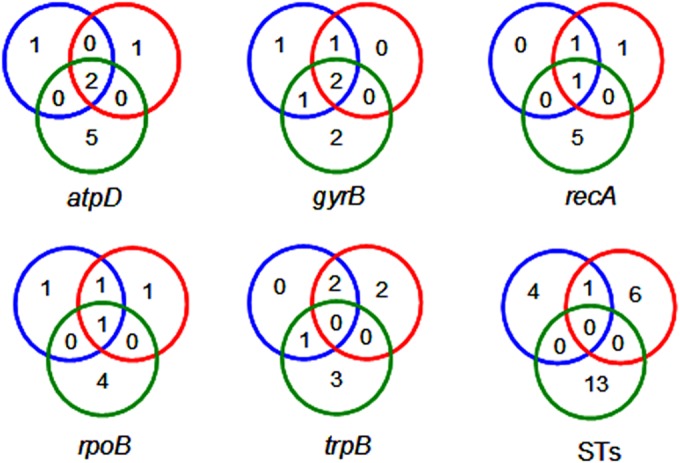
Venn diagrams of allele and ST distributions. Red, blue, and green circles represent the edaphic, marine, and entomic groups, respectively. Numbers inside the circles indicate the numbers of alleles or STs in each set.
Official websites use .gov
A
.gov website belongs to an official
government organization in the United States.
Secure .gov websites use HTTPS
A lock (
) or https:// means you've safely
connected to the .gov website. Share sensitive
information only on official, secure websites.
Venn diagrams of allele and ST distributions. Red, blue, and green circles represent the edaphic, marine, and entomic groups, respectively. Numbers inside the circles indicate the numbers of alleles or STs in each set.