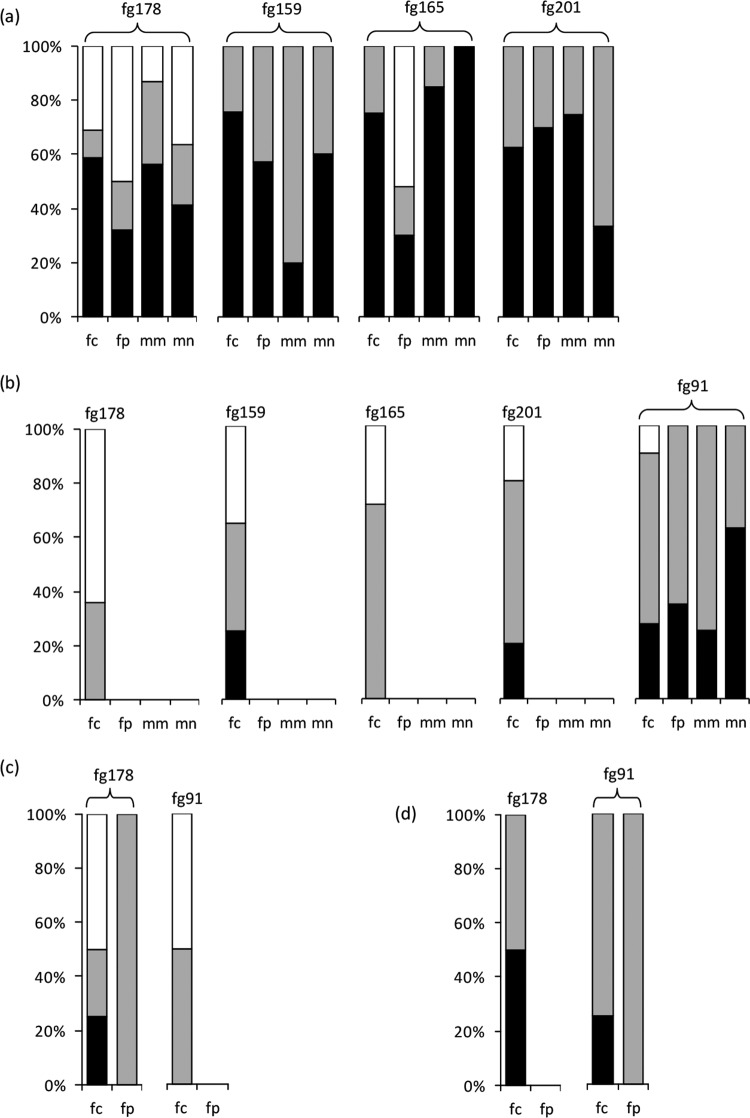
FIG 4.
Differences between measured and expected contents of DON (a, greenhouse experiments; c, field experiment) and NIV (b, greenhouse experiments; d, field experiment) in individual wheat spikes in which Fusarium graminearum was coinoculated with F. culmorum, F. poae, or Microdochium nivale. Black, gray, and white bars indicate the percentages of spikes in which the measured toxin content was significantly lower, not different, or higher, respectively, than the level expected from single inoculation data (Wilcoxon test). The figures synthesize the coinoculation data for the 2010 and 2011 greenhouse experiments (DON; isolates fc124, fc129, fc233, fc337, fp3, fp4, fp6, fp14, mn58, mn221, mn227, and mn229) (a), the 2010 and 2011 greenhouse experiments (NIV; isolates fc124, fc129, fc233, fc337, fp4, fp6, fp14, mn58, mn221, mn227, and mn229) (b), the 2011 field experiment (DON; isolates fc124, fc337, and fp3) (c), and the 2011 field experiment (NIV; isolates fc124, fc337, and fp3) (d). The F. graminearum isolates are indicated on the graphs. Values for individual spikes are also presented in Fig. S1 in the supplemental material.

