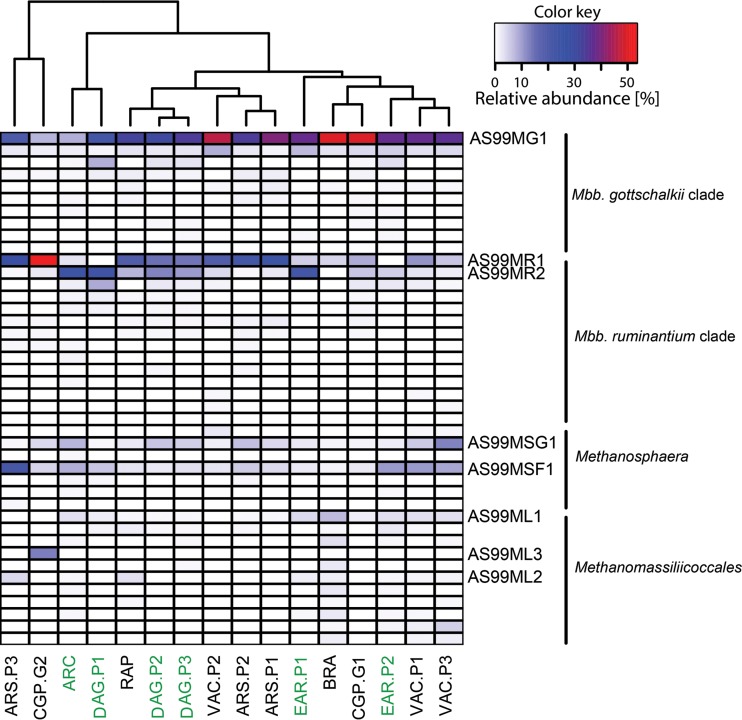
FIG 3.
Hierarchical clustering of sample groups based on the mean of the relative abundance of each OTU in each sample group. Samples were rarefied to 190 reads, and only OTUs with a mean relative abundance of at least 0.02 were included. These OTUs were 10 Methanobrevibacter gottschalkii clade OTUs, 14 Methanobrevibacter ruminantium clade OTUs, seven Methanosphaera OTUs, and 11 Methanomassiliicoccales OTUs. Names of animal cohorts are shown below the heat map, with the color of the font indicating the host species (green = cow, black = sheep). Heat map colors represent relative abundance of OTUs (in percent).

