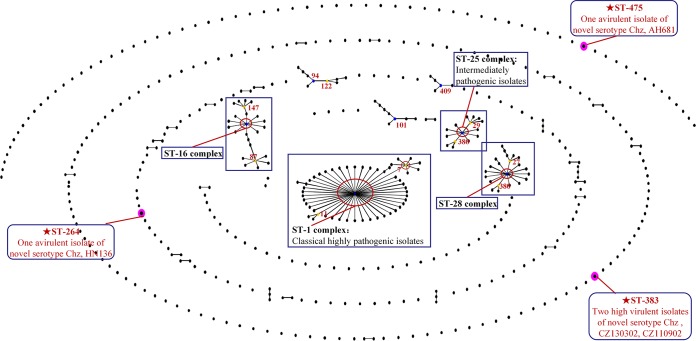
FIG 6.
eBURST diagram of the S. suis population. Population snapshots of S. suis of related STs within the entire S. suis MLST database were constructed. Each ST is represented as a dot. Two dots separated by one node represent a single-locus variation between two STs (a single-locus variant). The STs positioned centrally in the clonal complex (CC) are primary founders (blue) or subgroup founders (yellow). STs in purple circles are those identified in this study. For clarity, labels of STs have been removed, except related STs and founders in CCs. Some STs are labeled with blue boxes to emphasize their importance. The eBURST diagram does not show the genetic distance between unlinked STs and CCs.

