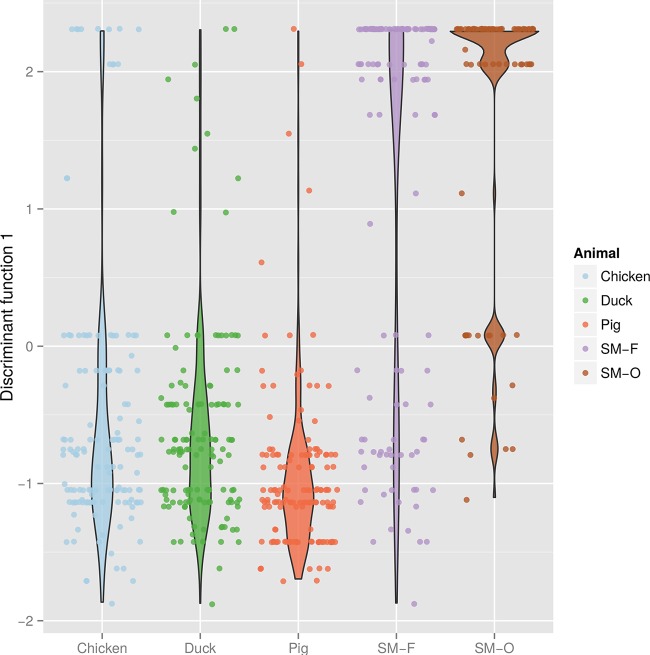
FIG 5.
Representation of DAPC of AMR profiles by host type (Dong Thap, Vietnam, 2012 and 2013). Each dot corresponds to a given profile. The colored density curves indicate the distributions of profiles on the first discriminant function, with thicker shapes corresponding to more profiles at that position. Within a given host type, positions of the profiles on the x axis have been randomized for better visualization.

