FIG 4.

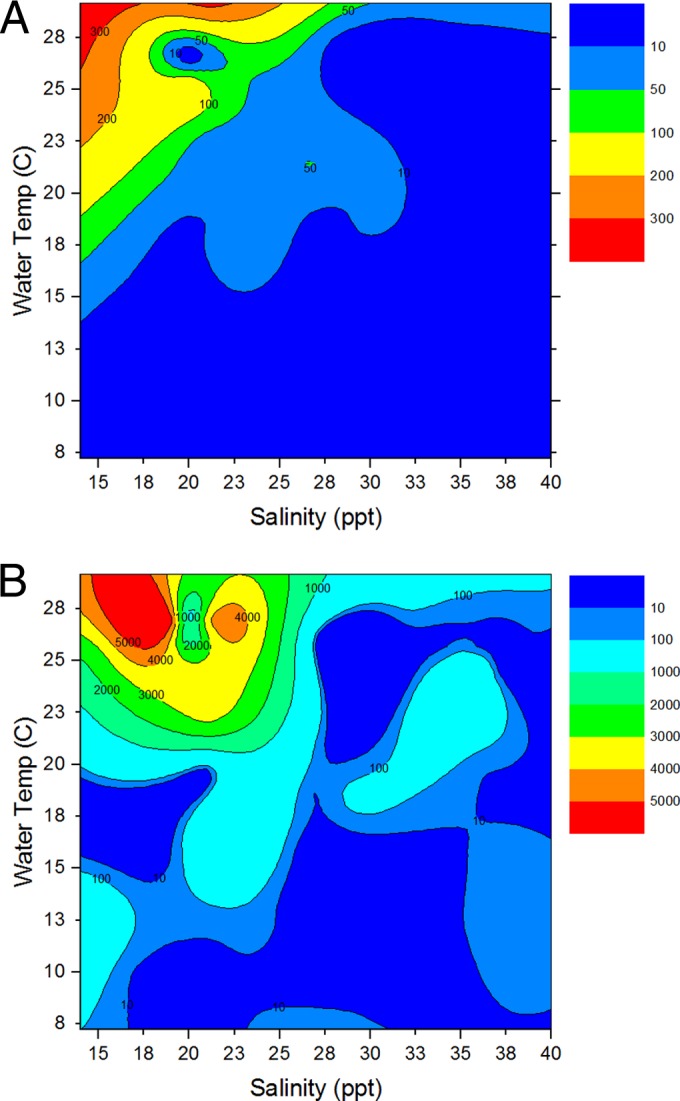
Heat maps of V. vulnificus abundances in water (A) or oyster (B) samples by salinity and water temperature during the collection period. Numbers on heat maps and in keys represent bacterial counts in CFU/ml for water and CFU/g for oysters.

Heat maps of V. vulnificus abundances in water (A) or oyster (B) samples by salinity and water temperature during the collection period. Numbers on heat maps and in keys represent bacterial counts in CFU/ml for water and CFU/g for oysters.