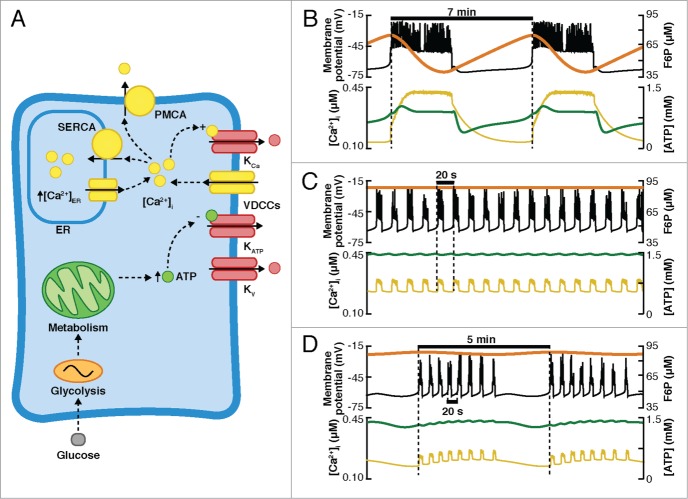
Figure 7.
Intrinsic metabolic oscillations (DOM model). (A) Diagram of the DOM model. The interactions between glycolytic, metabolic, and electrical components drive different electrical behaviors (simulations shown in B–D) depending on the regime of the glycolytic and electrical components. Glucose is metabolized by the glycolytic and metabolic components controlling the production of ATP, which mediate the changes in the conductance of the KATP channels, depolarization, and Ca2+ influx. The 3 compartments (glycolytic, electrical, and metabolic) are affected by the changes in [Ca2+]i. (B) Slow bursting is produced entirely by oscillatory glycolysis. (C) Fast bursting produced by the electrical component. (D) The combination of glycolytic and electrical components produces compound bursting activity. (B–D) Top: Vm (black curve) and the state of glycolysis (represented by F6P, orange curve). Bottom: [Ca2+]i (yellow curve) and [ATP]i (green curve).

