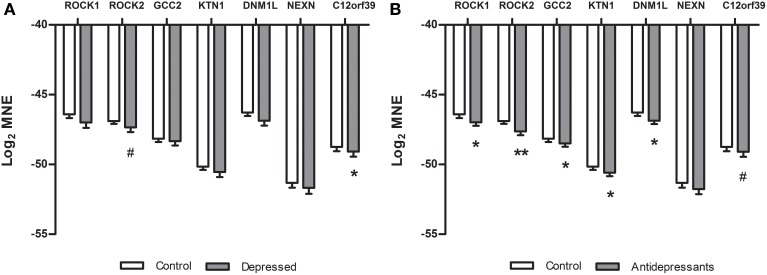
Figure 2.
Differences in gene expression (qPCR) between subsets in the validation study of the microarray data. Log2 mean normalized expression (MNE) is shown for the ROCK1, ROCK2, GCC2, KTN1, DNM1L, NEXN, and C12orf39 genes in depressed (A) and SSRI women (B). (A) *P = 0.05, #P = 0.08, (B) *P ≤ 0.05, **P < 0.01, #P = 0.07.

