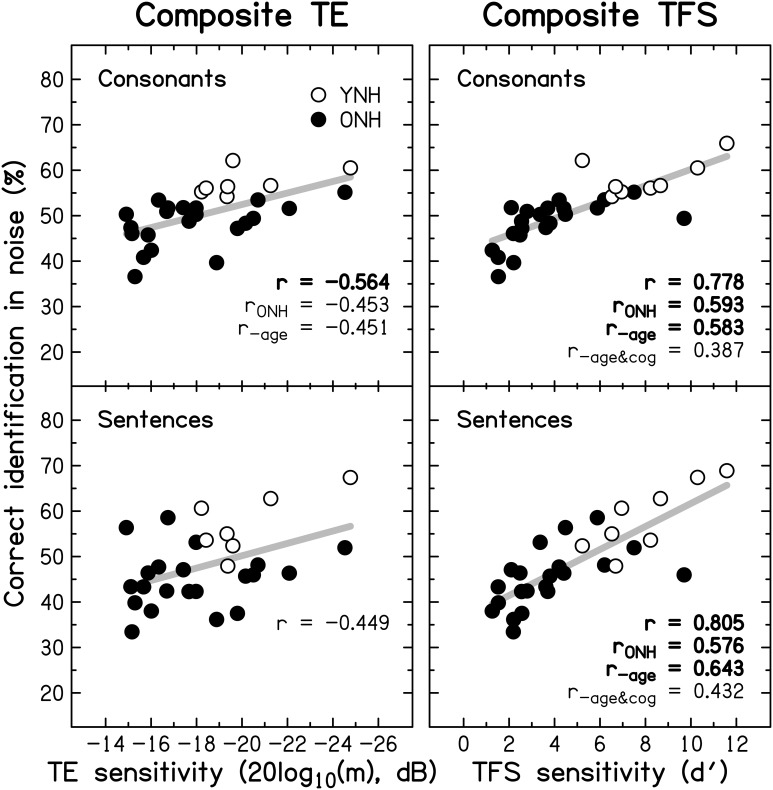
Figure 10.
Scatter plots of composite sensitivity to TE (left panel) and TFS (right panel) vs. composite consonant (top row) and sentence (bottom row) identification in noise. The thick gray line represents the best linear fit to the data from the entire group composed of YNH (open symbols) and ONH participants (filled symbols). Significant (at p ≤ 0.05; uncorrected) correlation coefficients for all participants (r), for the ONH participants only (rONH), and for all participants with age (r−age) or with age and composite cognition (r−age&cog) partialled out, are given in each panel. Bold font indicates significance at p ≤ 0.001.

