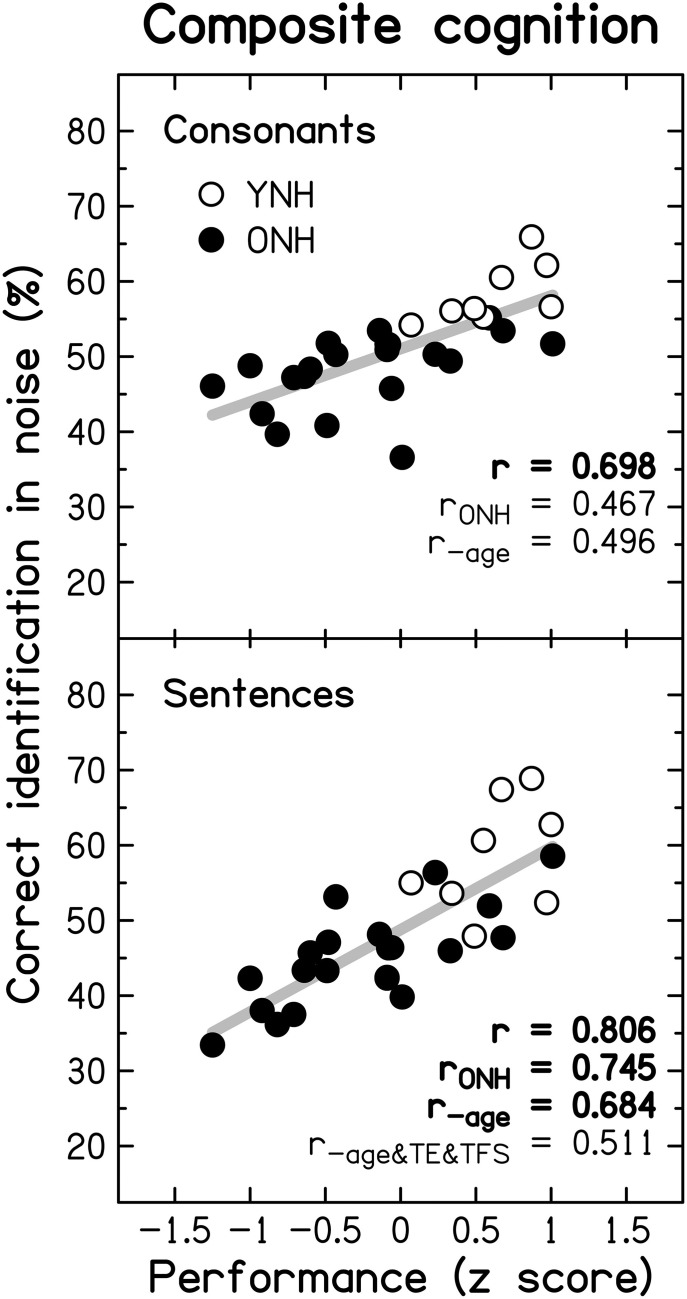
Figure 12.
Scatter plots of composite cognition vs. consonant (top row) and sentence identification in noise (bottom row). Significant (at p ≤ 0.05; uncorrected) correlation coefficients for all participants (r), for the ONH participants only (rONH), and for all participants with age (r−age) or with age and composite TE and TFS sensitivity (r−age&TE&TFS) partialled out, are given in each panel. Otherwise as Figure 10.

