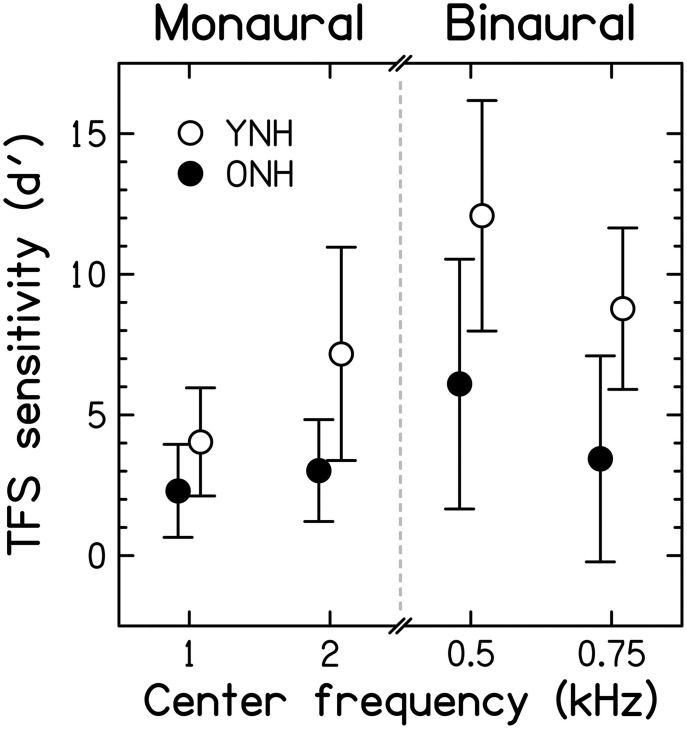
Figure 7.
Scores for TFS sensitivity, expressed in terms of the sensitivity index, d′, for the two fundamental frequencies used in the monaural TFS1 test and the two pure-tone frequencies used in the binaural TFS-LF test. Open and filled symbols denote results for the YNH and ONH participants, respectively. Error bars represent ±1 SD. Better TFS sensitivity is toward the top of the figure.

