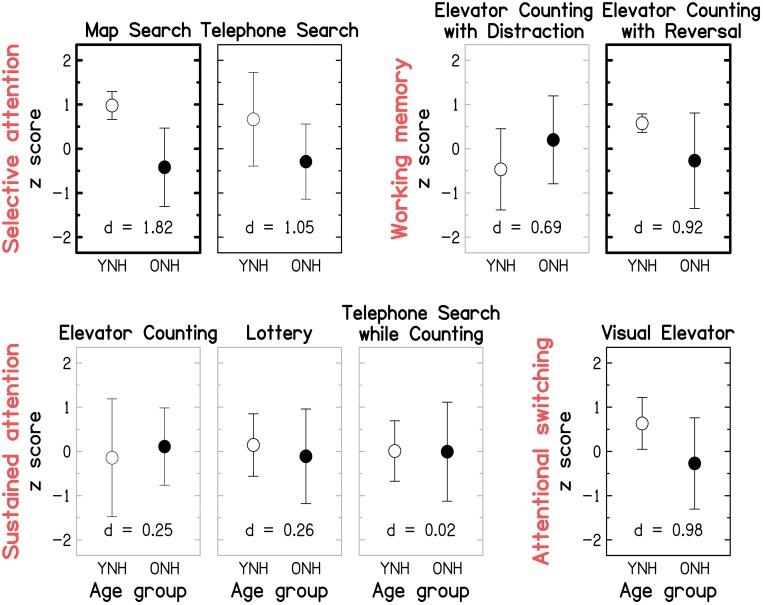
Figure 9.
Group-mean performance (in z-scores) for YNH (open symbols) and ONH (filled symbols) participants on each of the eight sub-tests of the Test of Everyday Attention. Sub-tests are grouped by the underlying attentional processes (see red labels) they are assumed to assess according to Robertson et al. (1996): Selective attention (Map Search, Telephone Search), Audio-verbal working memory (Elevator Counting with Distraction, Elevator Counting with Reversal), Sustained attention (Elevator Counting, Lottery, Telephone Search while Counting), and Attentional switching (Visual Elevator). Gray panel frames indicate non-significant group differences (p > 0.05). Black panel frames denote significant results at p ≤ 0.05. Bold panel frames indicate significant results after applying a Holm-Bonferroni correction. Otherwise as Figure 8.

