
Figure 5.
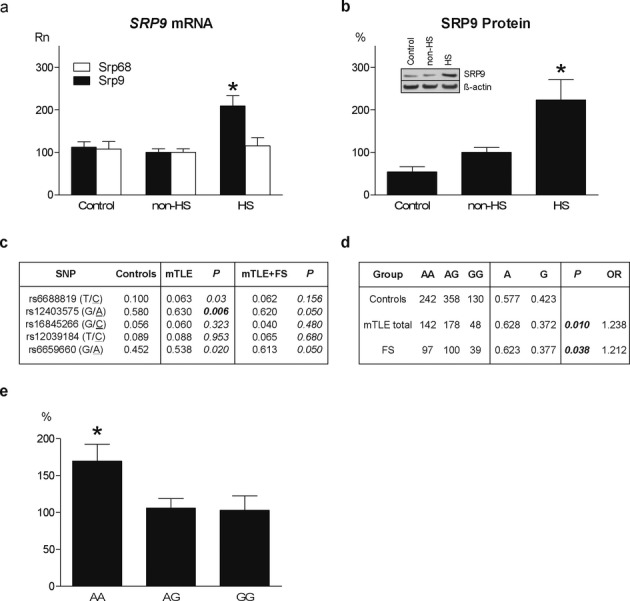
SRP9 expression and sequencing in patients with mTLE and/or FS. (A) SRP9 mRNA levels (normalized qPCR data: Rn) in hippocampal homogenates of autopsy controls (Control; n = 15; Rn = 112.3 ± 12.3) and mTLE patients without (non-HS; n = 19; Rn = 100.0 ± 8.2) and with hippocampal sclerosis (HS; n = 21; Rn = 209.0 ± 24.4). (F2,52 = 12.023, P = 0.0001; non-HS vs. HS: P = 0.008; Control vs. HS: P = 0.001; Control vs. non-HS: P = 1.000). SRP68 mRNA levels did not differ between groups (Control Rn = 107.8 ± 17.6; non-HS Rn = 100.0 ± 8.1; HS Rn = 115.1 ± 19.3; F2,36 = 0.203, P = 0.817. (B) SRP9 protein (insert shows Western blot with loading control β-actin) in hippocampal homogenates of Controls (n = 6; 53.9 ± 12.2), non-HS (n = 12; Rn = 100.0 ± 11.6), and HS (n = 11; Rn = 223.2 ± 47.6) patients. (F2,26 = 6.685, P = 0.005; non-HS vs. HS: P = 0.023; Controls vs. HS: P = 0.009; Controls vs. non-HS: P = 1.000). Error bar indicates SEM. *Significantly different after multiple testing correction P < 0.01. (C) Sequencing of SRP9 exons, intron/exon boundaries and promoter region (5 kb) in healthy controls (n = 169), mTLE patients (n = 368) and mTLE patients with FS (n = 91) revealed a significant (P < 0.01 bold) difference in allele frequencies of one common promoter SNP (rs12403575 G/A) in mTLE patients. P-value corrected for multiple SNP testing P < 0.01. All SNPs in the sequenced region with an allele frequency >0.05 were selected for the assocation study. In the HS group 46% had antecedent FS, in the non-HS group only 6%. (D) Further single SNP analysis using a larger control cohort (n = 730) identified a significant association between rs12403575 and mTLE (n = 368, P = 0.01, odds ratio (OR) = 1.238). This association was replicated in patients with FS without mTLE (n = 236, P = 0.038, OR = 1.212). (E) Patients with AA genotype had a significantly (F2,33 = 4.142, P = 0.023) higher hippocampal SRP9 expression (Rn = 169.7 ± 22.9) than patients with AG genotype (Rn = 105.9 ± 13.1, P = 0.044), and GG genotype (Rn = 103.1 ± 19.6, P = 0.058). Data are expressed as means ± SEM. *Significantly different P < 0.05.