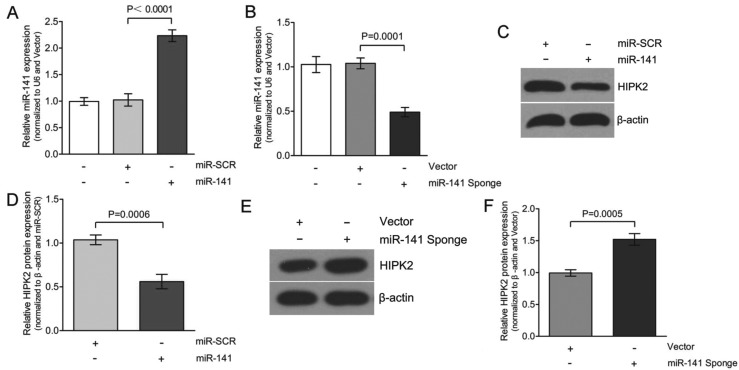
Figure 4.
miR-141 represses the expression of HIPK2. HK-2 cells were transfected with (A) miR-SCR or with miR-141, or (B) with control (Vector) or the inhibitor of miR-141 (miR-141 Sponge), and RNA was harvested after 2 days. The expression of miR-141 was assessed by qPCR and normalized to U6 expression; shown as mean ± standard error (S.E). Western blot analysis demonstrated a decrease in HIPK2 by (C) miR-141 and (E) miR-141 Sponge. The figures are representative of three experiments with similar results. (D and F) The western blotting results in C and E were quantified to determine whether a statistically significant difference exists between the groups and are shown in a graph format (P<0.05 compared to control). The intensities of all bands corresponding to HIPK2 were compared to those corresponding to β-actin. The expression of HIPK2 was determined as a relative change from miR-SCR or vector transfection and shown as mean ± S.E. HIPK2, homeodomain-interacting protein kinase 2; qPCR, quantitative polymerase chain reaction.

