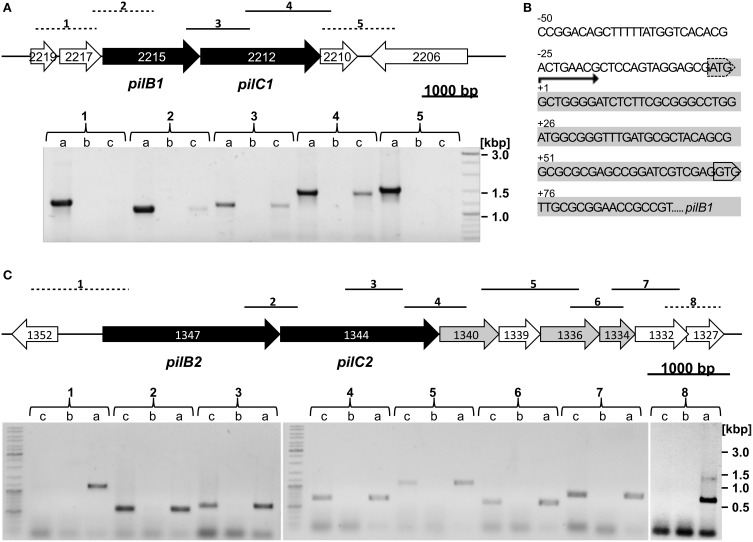
Figure 2.
Genomic regions and transcriptional analyses of the pil-1 and pil-2 loci. (A) Top: pil-1 locus with genes encoding the putative type IV pili assembly ATPase (pilB1) and putative transmembrane protein (pilC1) marked in black. Bottom: RT-PCR to determine a putative co-transcription using oligonucleotides amplifying fragments across the intergenic regions (brackets numbered 1 to 5 above the gel correspond to fragments 1 to 5 in the gene map; dashed lines, no co-transcription detected; full lines, co-transcription detected). For each pair of adjacent genes the three lanes in the gel represent (a) PCR product using Hbt. salinarum R1 genomic DNA as template to validate the amplicon size and oligonucleotides specificity; (b) PCR product with RNA of planktonic Hbt. salinarum R1 cells without reverse transcription; (c) RT-PCR product. (B) Upstream and 5′ nucleotide sequence of pilB1 (OE2215R, shown in grey) and the AUG translation start codon predicted for OE2215R is marked by a dashed box. The transcription start site determined by primer extension is labeled +1. The alternative GUG translation start codon is boxed. (C) Top: pil-2 locus with genes encoding the putative type IV pili assembly ATPase (pilB2) and putative transmembrane protein (pilC2) marked in black. Putative prepilin encoding genes are shown in grey. Bottom: RT-PCR experiment investigating co-transcription of the pil-2 genes similarly to pil-1 as explained in 2A. Brackets numbered 1 to 8 in the gel correspond to fragments 1 to 8 in the gene map.

