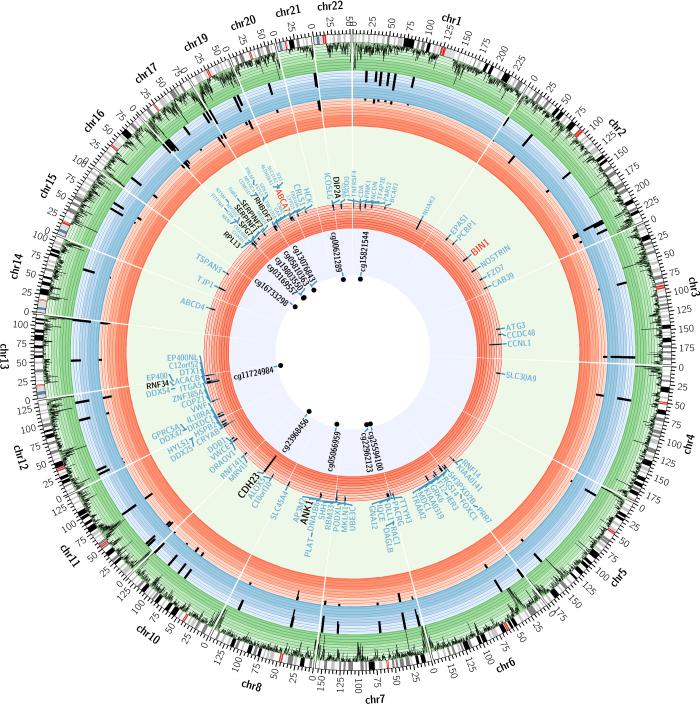
Figure 1. Summary of the genome-wide brain DNA methylation scan for NP burden and its validation using two sets of brain RNA data.
Each sector of this diagram presents summary results of the three different analyses within a chromosome. The perimeter of this circular figure presents the physical position along each chromosome (in Mb). The cytogenetic bands of each chromosome are presented in the first circle, with the centromere highlighted in red. The next circle (green) reports the density of CpG probes successfully sampled by the Illumina beadset that are present in a given genomic segment. The blue circle reports the results of the DNA methylation scan: using a “–log(p-value)” scale, we report the results for each of the 71 associated CpG found in 60 independent differentially methylated regions (DMR) from the analysis relating DNA methylation levels to NP burden. Similarly, the first red circle reports the –log(p-value) for the 71 CpGs in the replication analysis. The large lightly colored circle reports the names of genes found within 50 kb of each associated CpG (light blue letters). The ABCA7 and BIN1 regions, which harbor AD susceptibility alleles, are highlighted in red letters. The subset of the genes with differential mRNA expression in AD in the Mayo clinic dataset are shown in black. The next, red circle reports the results of the association of RNA expression level of these genes to a diagnosis of AD in the Mayo clinic dataset. The central circle reports the set of validated CpGs who also have nearby genes whose expression is altered.

