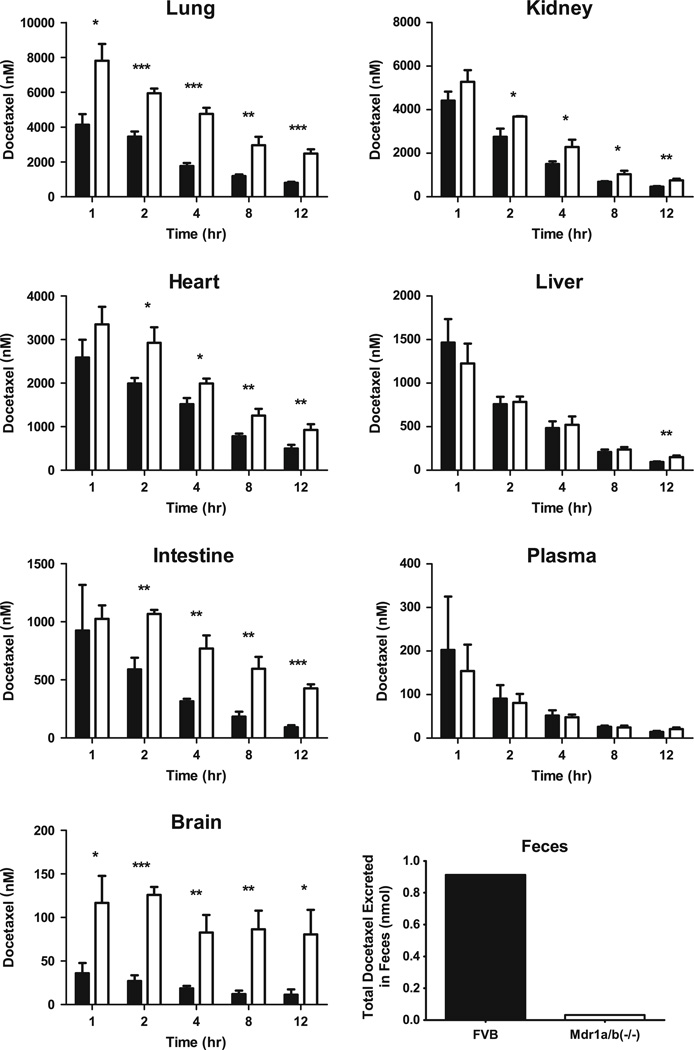
Fig. 1.
Observed docetaxel concentrations in mouse lung, kidney, heart, liver, intestine, plasma and brain and observed total docetaxel amount in feces following an intravenous dose of 3 mg/kg. Black bars represent the data from FVB mice. White bars represent the data from Mdr1a/b knockout (KO) mice. For all observed data, error bars symbolize SD

