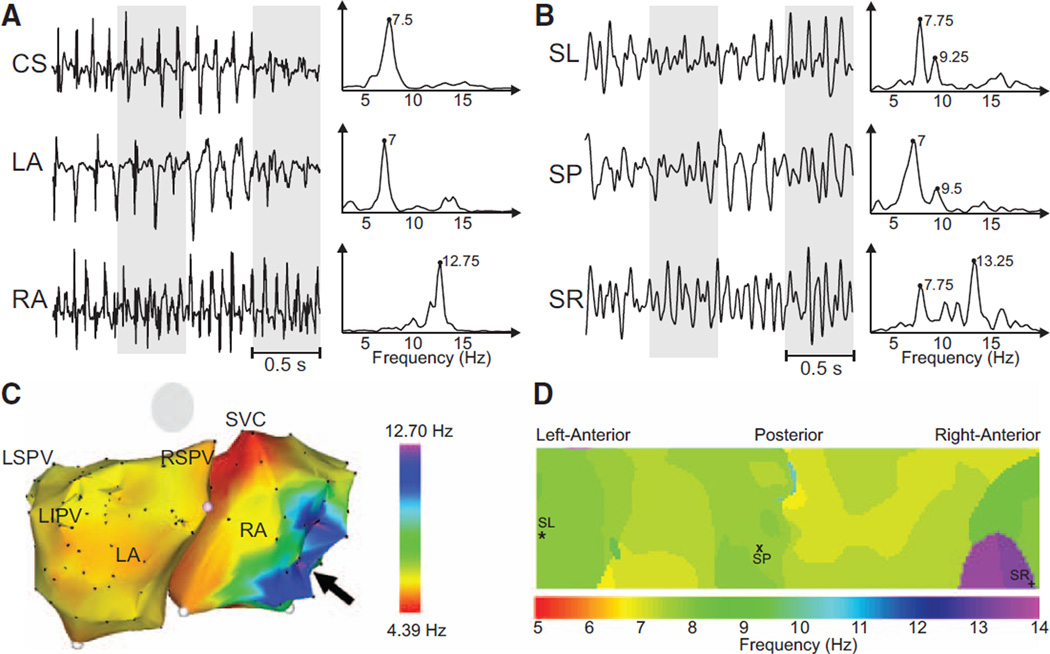
Figure 3.
Recorded electrograms (EGMs) and ECGs and their dominant frequency (DF) distribution in a sample patient with a right-to-left DF gradient. A, EGMs recorded at different atrial sites and their corresponding power spectra. B, Selected surface body surface potential mapping leads and their corresponding power spectra. C, Intracardiac DF map. Black arrow points to the right atrial (RA) region with highest DF at the RA. D, DF map on the torso surface with superimposed locations of electrodes from (B). CS indicates coronary sinus; LA, left atrial; LIPV, left inferior pulmonary vein; LSPV, left superior pulmonary vein; RSPV, right superior pulmonary vein; SL, surface left; SP, surface posterior; SR, surface right; and SVC, superior vena cava.

