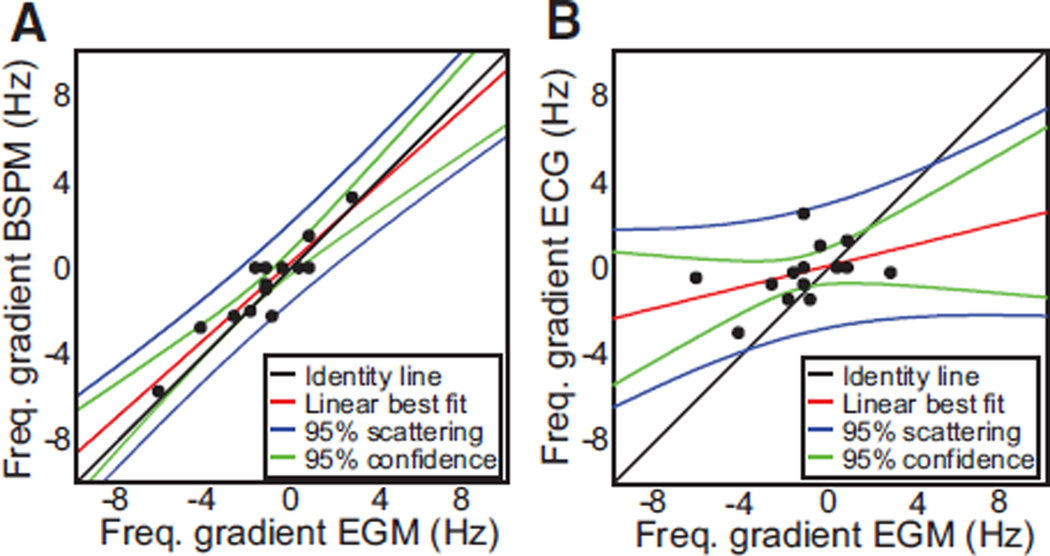
Figure 6.
Regional differences (gradients) of intracardiac dominant frequency (DF) and their reflection on the body surface. A, Frequency gradients calculated as highest left DF minus highest right DF. Body surface potential mapping (BSPM) gradients are plotted against those from the electrograms (EGMs). B, Frequency gradients from the standard ECG are plotted against those from the EGMs. For the standard ECG’s DF gradient, highest left frequency was selected among aVL, V4, V5, and V6 leads, and highest right frequency was selected among aVR, V1, and V2.

