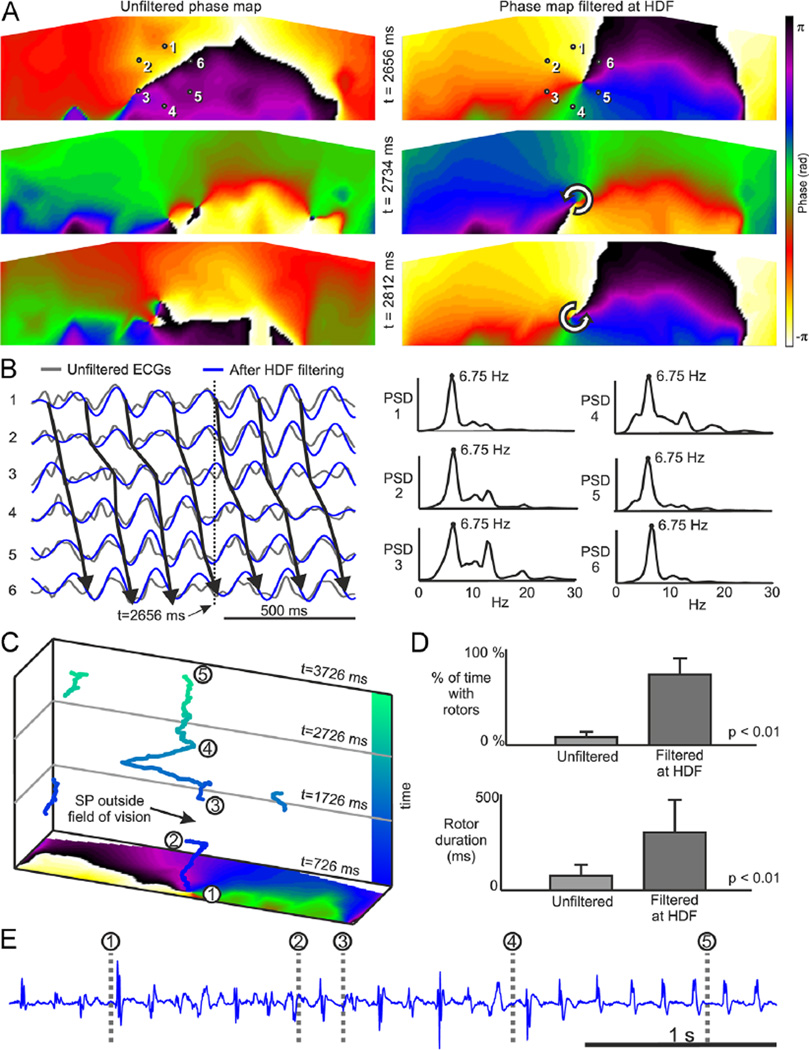
Figure 1.
Surface phase maps during AF. A: Surface phase maps at 3 selected times for unfiltered (left) and for HDF-filtered (right) surface potentials. B: ECGs at positions 1–6 marked in panel A before and after HDF filtering and PSD for unfiltered ECGs. Time marker at 2656 ms corresponds to the top map in the HDF-filtered data in panel A. C: SP trajectories on the torso surface during a 3-second long AF. D: Percentage of time with rotors (up) and rotor duration (down) in surface phase maps from unfiltered and HDF-filtered surface potentials over the entire cohort. E: Electrogram recorded at the highest DF site in the atria (RSPV) simultaneously with the surface recordings. AF = atrial fibrillation; DF = dominant frequency; ECG = electrocardiogram; HDF = highest dominant frequency; PSD = power spectral density; RSPV = right superior pulmonary vein; SP = singularity point.

