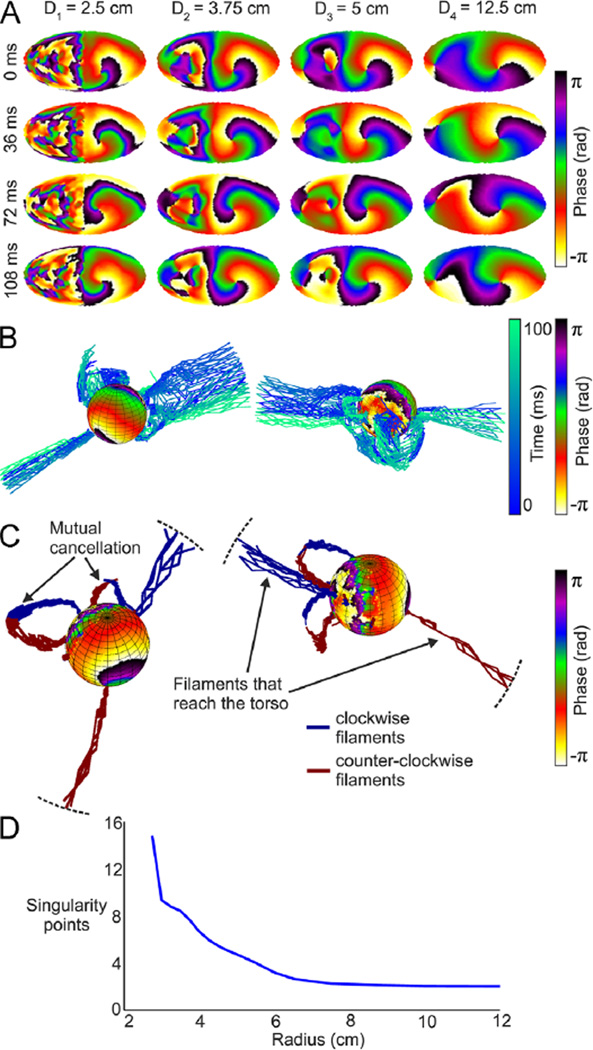
Figure 3.
Epicardial and transition to surface phase maps during AF in a 50% LA-50% fibrosis atrial model. A: Phase maps at 4 time instants (top to down) in 4 concentric layers at increasing distances from the epicardium (left to right). B: Phase map of the epicardial sphere and temporal evolution of filaments for unfiltered potentials. C: Phase map of epicardial sphere and distribution of filaments (clockwise rotations in blue; counterclockwise rotations in red) inside the torso during 10 ms. D: Average number of rotors per frame. AF = atrial fibrillation; LA = left atrial.

