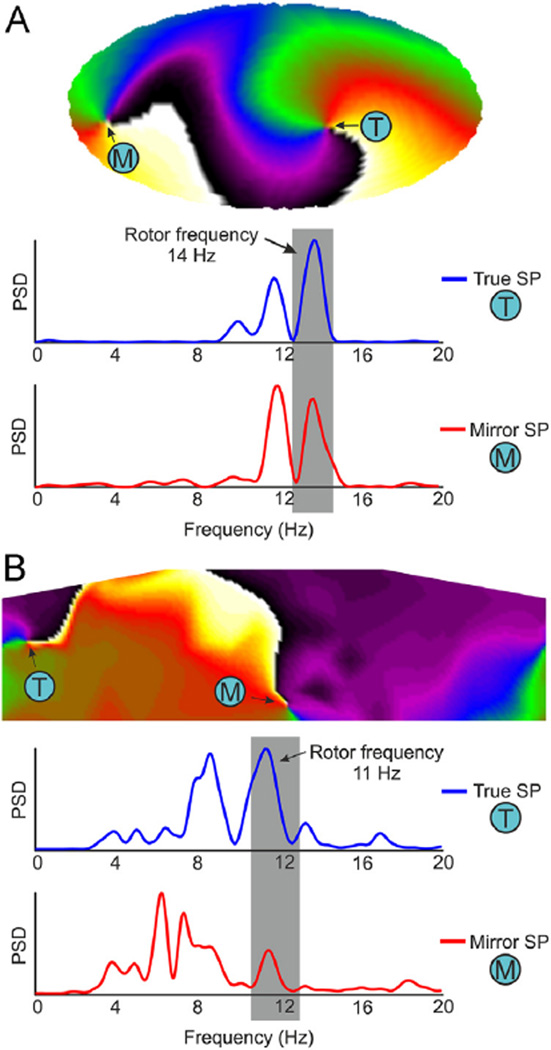
Figure 4.
Discrimination of true and mirror SPs at surface phase maps in a simulated and human AF. A: Surface phase map in a 50% LA-50% fibrosis atrial model and power spectra of surface potentials at the true rotor location (blue, T) and at the mirror rotor location (red, M). B: Surface phase map after HDF-filtering from patient 11 during AF and power spectra of surface potentials before the filtering at the true rotor location (blue, T) and at the mirror rotor location (red, M). AF = atrial fibrillation; HDF = highest dominant frequency; LA = left atrial; PSD = power spectral density; SP = singularity point.

