
Fig. 1.
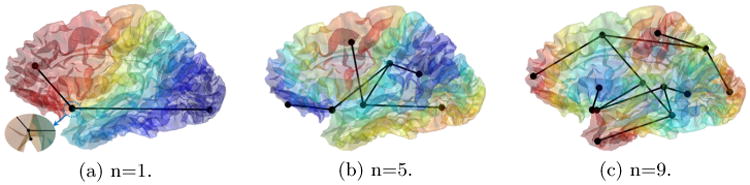
The Reeb graphs of the 1st, 5th, 9th eigenfunction of a cortical surface. In (a)-(c), the surface is color-coded with the corresponding eigenfunction. A zoomed view of a spurious critical point was shown (a).
Official websites use .gov
A
.gov website belongs to an official
government organization in the United States.
Secure .gov websites use HTTPS
A lock (
) or https:// means you've safely
connected to the .gov website. Share sensitive
information only on official, secure websites.
The Reeb graphs of the 1st, 5th, 9th eigenfunction of a cortical surface. In (a)-(c), the surface is color-coded with the corresponding eigenfunction. A zoomed view of a spurious critical point was shown (a).