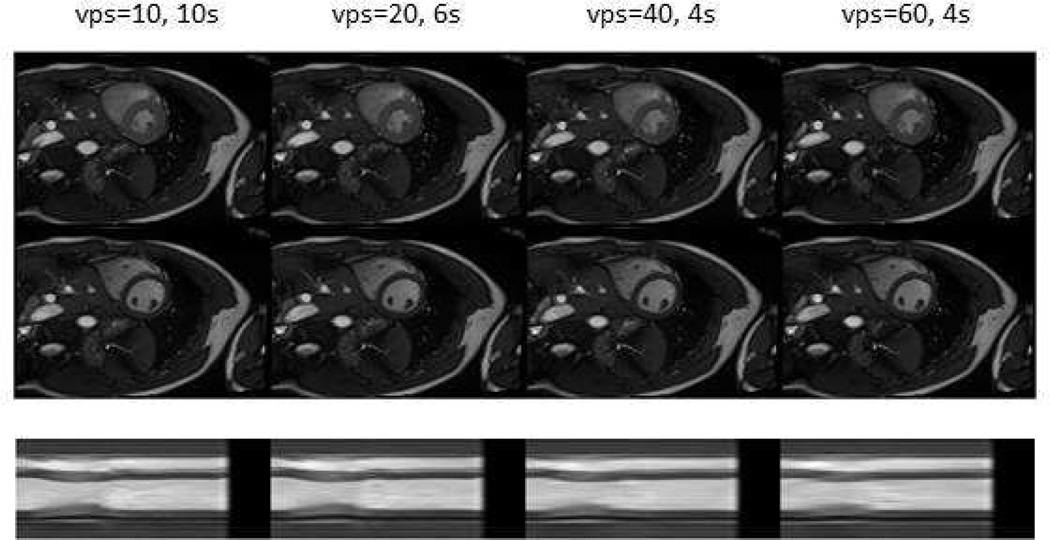
Figure 2.
Short axis view images at end-systolic (first row) and end-diastolic (second row) phases with different selections of views per segment (10, 20, 40, and 60). The third row show a cross section profile (a vertical line in the short axis view image) plotted along time (horizontal axis). Notice the increased temporal blurring (horizontally in the third row) with increased views per segment.

