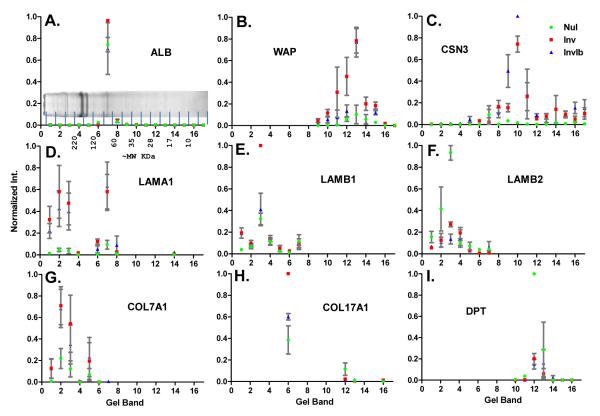
Figure 2. Relative abundance of select proteins based on normalized peak area for all peptides assigned per band.
A) Colloidal coomassie blue stained SDS-PAGE image of matrix isolated from nulliparous, treated animals with approximate molecular weights based on molecular weight markers. Approximate location of the 17 gel bands is shown. Peptide identifications throughout the 17 bands for A) Albumin (ALB), B) Whey acidic protein (WAP), C) κ-casein (CSN3), D) laminin α1 (LAMA1), E) laminin β1 (LAMB1), F) laminin β2 (LAMB2), G) collagen VII α1 (COL7A1), H) collagen XVII α1 (COL17A1), and I) dermatopontin (DPT). Calculated ion intensities normalized for each replicate to max intensity from the four samples. Nul=nulliparous, Inv=control involution, InvIb=ibuprofen involution

