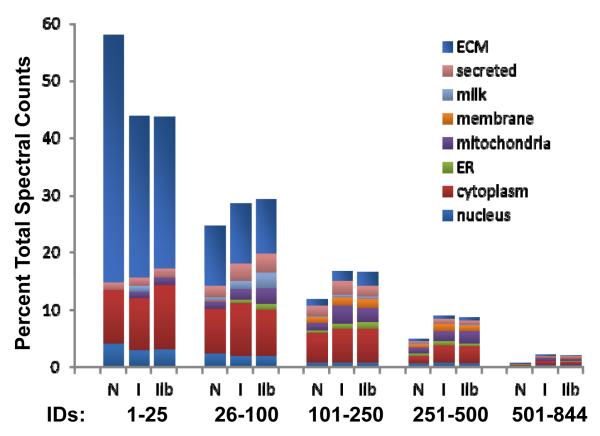
Figure 3. Estimation of protein abundance based on spectral counts.
Spectral counts were used to estimate the percentage of proteins from a given cellular component; results are presented for the top 25, next 75, 150, 250 and 488 proteins based on peptide counts. N=nulliparous, I=control involution, IIb=ibuprofen involution

