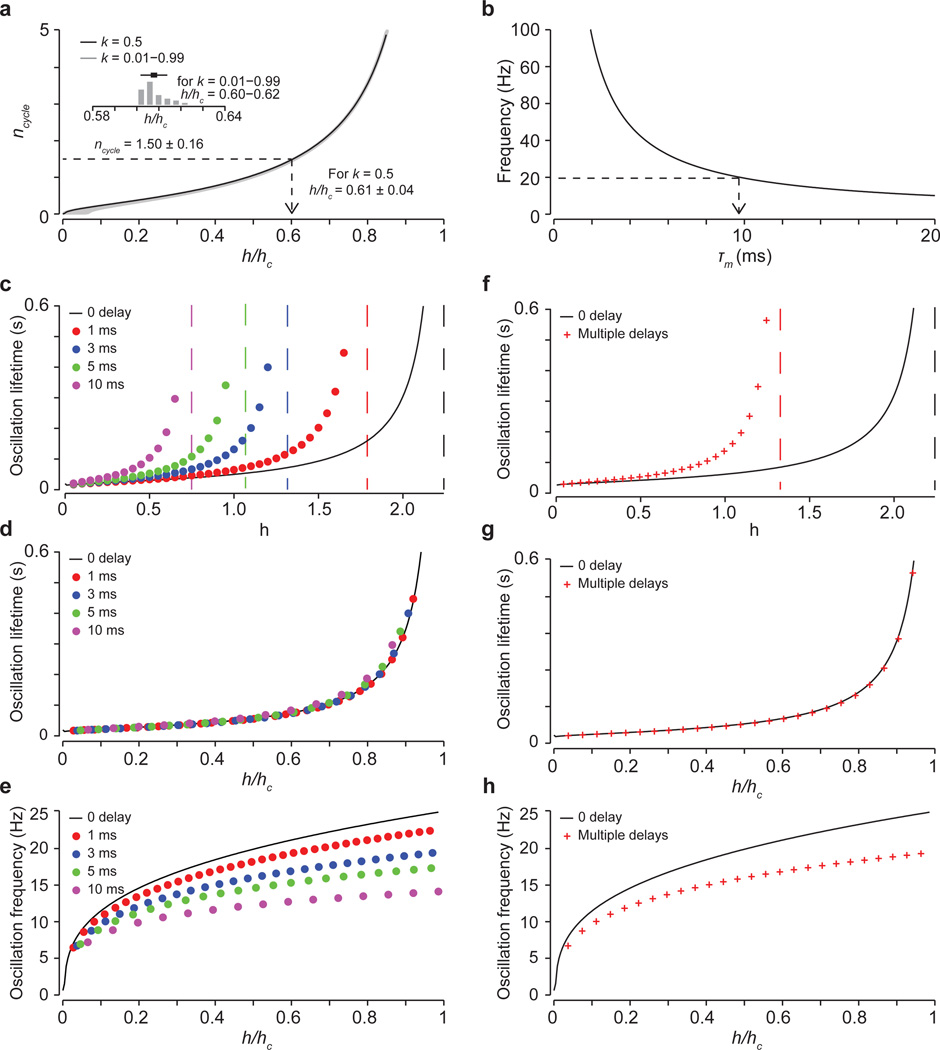
Extended Data Figure 8. Fitting the model to the frequency and decay time of post-DT reach velocity oscillations.
a, To fit the model parameters to the experimentally derived frequency and decay times, we took advantage of the fact that the product of the oscillatory frequency and decay time (foscτosc) creates a parameter free value ncycle, which does not depend on the muscle time constant. The term ncycle corresponds to the number of oscillatory cycles per decay time constant and scales as a function of feedback gain. Plotting ncycle as a function of feedback gain (h/hc, where hc is the critical gain above which oscillations do not decay) permits estimation of the gain value that corresponds to the experimentally derived value of ncycle. Importantly, the corresponding gain value does not depend on the drag parameter k (inset and grey shading beneath black curve). Varying k by 100-fold results in minimal changes in the corresponding gain, with h/hc varying from 0.6 to 0.62. The grey curves represent the relationship between ncycle and h/hc across the full range of k values. Arrow indicates the gain value corresponding to the experimentally derived vale of ncycle for k = 0.5. See Supplementary Note 4 and Methods. b, To estimate the appropriate muscle time constant, we used the five dimensional matrix that defines the model (see Methods) to calculate the imaginary part of the complex eigenvalue corresponding to k = 0.5 and h/hc = 0.61. We found a time constant of τm = 9.6 ms (indicated by the arrow), which is within the range used in the original model11 based on experimentally-derived values57. c, Introduction of delays in the feedback loop does not alter the basic properties of the model. Oscillation lifetime (τosc) as a function of absolute gain h for delays of 1 ms, 3 ms, 5 ms and 10 ms as compared to no delay (black trace). The vertical dashed lines indicate the gain level above which oscillations never decay (the critical gain, hc) for each delay value. d, Scaling these curves by their corresponding critical gain values reveals equivalent oscillatory lifetimes (h/hc). e, Oscillation frequency (fosc) as a function of normalized gain. As feedback delays increase, peak oscillatory frequency decreases. For higher delay conditions, where the oscillation frequency is significantly below 20 Hz, decreasing the muscle time constant results in higher oscillation frequencies. Thus for longer delays ~20 Hz oscillation is possible, but requires an increasingly small muscle time constant. f–h are as c–e but with three simultaneous loops of different delays (1 ms, 3 ms and 5 ms). In the presence of multiple simultaneous feedback delays the model continues to oscillate at a single dominant peak frequency for a given gain level. See Supplementary Note 5.

