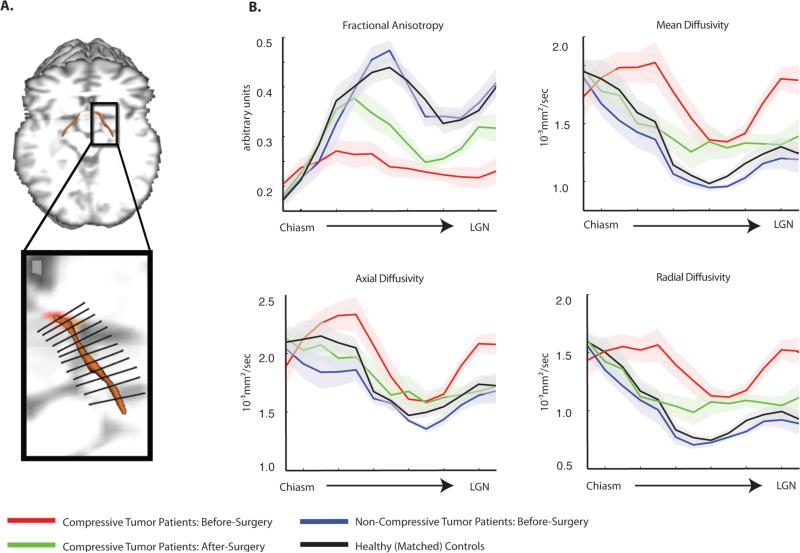
Figure 3. Along-tract analysis of diffusion indices.
(A) Displayed is a schematic illustration of a segmented optic tract into thirteen equidistant bins from the chiasm to LGN using the along-tract statistics algorithm implemented in this study (for the basis of this approach, see Merwade et al., 2005; for all details, see Supp. Materials and Fig. S4). (B) Measures of diffusion (fractional anisotropy, mean diffusivity, axial diffusivity, and radial diffusivity) were extracted from each segment, for each participant, and are plotted by segment position within each group. The shaded region around each line represents the standard error of the mean (over participants). The consistent pattern of variability in diffusion measurements, for all participant groups, along the length of the optic tract results from the proximity of the optic tracts to major fiber bundles, particularly the corticospinal tracts. This observation is in line with previous studies of the optic tracts (49) and other white matter fiber bundles (44).

